
Last edited:
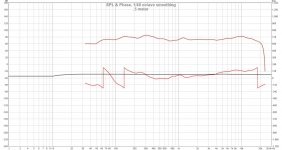
Here we go. This measurement is taken 3' away from the FR driver. could this be the reason woofers no presenting itself?
Year it could be if woofer cone is not situated facing forward below or on top of FR.
Is this response by any chance a MA FR with a under hung surround : )
Listening position.
Great there is your woofer and not a bad response at LP compared to up front, woofer could maybe need +3-8dB boost but that's not up to me if you happy.
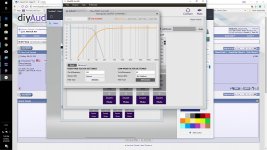
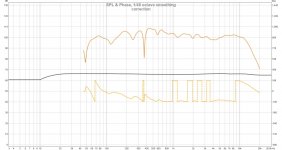
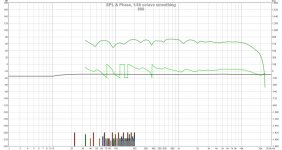
If you like some pointers then job is try to get the individual woofer and FR response look like mine first graph (orange+red traces) when measured in acoustic domain using filter correction inside miniDSP to correct their reponse curves, correcting one at a time and use whatever PEQ/low shelve/high shelve/high pass/low pass filters to massage that response for each those pass bands, the important thing to understand is those slopes shall be the acoustic measured one so it doesn't help set a same named HP or LP slope as an electric filter in DSP because those drivers have their own acoustic roll off stop band that when cascaded with a electric slope will add up to final roll off slope. Find attached a zip folder with two frd files to use as target files for your 80Hz Harsh system, use REWs import frq response feature then in "All SPL" tab or "Overlays" window you can use them overlaid with measured response to continuous EQ massage response to be a clone of those curves, they set to show up at 75dB SPL point but you can always move them up or down using "Controls" feature in the varius windows. Filters to use to base EQ correction think can vary a bit maybe start use that FDW 1/6 as before, down lows you can go down to 1/4 to filter more room out and up higher in frq up til 1/14 should work fine and get you more response wiggles or grass to correct for. Hope above is understandable else can think of use miniDSP forum where there often is guides and help.
After above two pass bands are set with right acoustic roll off slopes then sum them both plus FR (mid tweeter) needs be delayed 1/80 x 0,5 = 6,25mS relative to woofer but their physical position relative to each other and LP also counts here.
EDIT and a last thing is measurements for both pass bands they shall be in same polarity so check in "Impulse" window that direction for their impulse and step response goes in positive upwards direction, and if not correct it flip their cable or flip it electrical inside miniDSP.
Attachments
Last edited:
Thanks BYRRT for the write-up. I will experiment with Harsch on the midwoofer-mid and also on midwoofer-mid-tweet.
Isn't it also possible to use Arta as measurement software? It is really easy to generate target response from the 'Overlay' menu on FR1 measurements for example.
Isn't it also possible to use Arta as measurement software? It is really easy to generate target response from the 'Overlay' menu on FR1 measurements for example.
In past used JRiver DSP and ran a real electric loop with all those filters set into Jriver engine and in used soundcard beside analog I/O have pure digital I/O too then results got pretty textbook and clean. Later started use Rephase because its much faster and output as 64bit IEEE stereo or mono IR-file which when imported to REW can be manipulated in time over there beside change SPL and do all the math on "All SPL" tab, a note is use always IR with the same sample rate and if used as target curves pick same sample rate as your measurement chain use, and also if you filter measurements with windows or FDW do the same for target curves because it can sometimes make a little difference.
Over in Rephase there is not any fixed 2nd order Bessel slopes so use a LR2 and add a PEQ @XO-frq Q0,58/+1,3dB.
Hardest part is remember always to align impulses before any summing or other math, mid and tweeter bands align most often perfect using "Estimate IR delay" but the none sharp woofer band is often a little wrong aligned after that command in REW so some manual alignment is needed, the fastest way i found is after they aligned via "Estimate IR delay" then open "Overlays" window and pick its "Phase" tab where the woofer bands phase is clearly not overlaid together mid and tweeter band so now move woofers IR in programs main window for example minus 0,001ms at a time until its overlaid the other two bands. To do same for Harsch which haven't symmetric same slopes for HP verse LP you have to make one exstra temporary tweeter that have BW 4th order HP to get a reference to align woofer right.
For use in XSim export as frd-file from REW but remember first to align IR and mayby offset SPL to about 90dB levels.
MANY thanks for your answer. I now feel a little stupid, because I haven't considered to align the impulses 😱. I guess this would make a substantiel improvement when making the filters in Rephase!?
In Rephase are your settings at the "centering" the one that is standard ie:
Centering: "middle" and "use closest perfect impulse"
Or will this step actually "misalign" the impulses IF one already does this in REW.
Better yet?
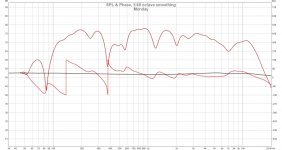
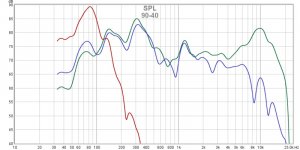
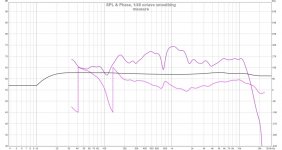
Can you do a near field measurement at 0.5m (remove effects of room reflections) and use FDW set to 6 cycles? Then show 3 traces (overlay plot): woofer only, wideband only, and both. Then we can see if Harsch is setup correctly. You should see characteristic rise and dip bass and small phase bumpninnotherwise flat phase if setup correctly.
Like this:
Then look at step response - that’s the “proof is in the pudding” part.
@mkane77g read the below quote from BYRTT to make your graphs more readable:
It will help to analyse things. Right now your vertical (Y) axis shows +180 dB to -240 dB... change that to the suggested 40 to 90 or 100 dB like BYRTT suggested. It will look more rough, but allows us to see it more clearly. Basically almost all graphs look like a flat line once you zoom out that much 😉.
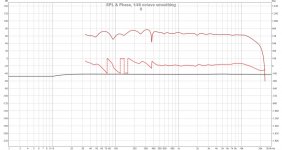
Mine graphs are synthetic textbook ones so they great as a quality check to compare your measurements.
Suggest open before measurement session and via "Limits" button at the right side up in top set other scales, for example a 10Hz to 25kHz X-axis and a +40 to+90dB Y-axis.
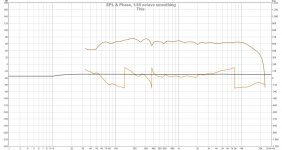
With above settings can you share before near field measurement with the window named "SPL & Phase" and ensure its legend below graph have phase ticked on because then we can compare to the third graph of mine, and wait a minute also hit "Controls" at upper right corner and push "Estimate IR Delay" maybe more than once until dialog tells delay is zero.
To compare second graph of mine pick "Impulse" window and with mouse inside graph window ensure setting in left top side of graph window is set to "% FS" and also use "Limits" button to tweak X and Y scales.
It will help to analyse things. Right now your vertical (Y) axis shows +180 dB to -240 dB... change that to the suggested 40 to 90 or 100 dB like BYRTT suggested. It will look more rough, but allows us to see it more clearly. Basically almost all graphs look like a flat line once you zoom out that much 😉.
Last edited:

- Home
- Loudspeakers
- Multi-Way
- S. Harsch XO