You use VDR in audio circuits? interesting🙄How about a VDR ? 😀
Mona
A resistor resists the flow of energy. It does not amplify in any way so a resistor is unable to 'distort'.
Changing the impedance producing a mismatch by changing a feed or load resistor can affect a circuits frequency and sensitivity. Distort on its own? No.
Yes it can. A resistor change * its value in the course of a sine wave, meaning it has a different R at different points on the wave. If, for instance, the R is part of a resistive divider (as in any measurement setup) the division ratio changes during a sine wave and that creates distortion. In the very same way that the changing gain of an amp during the sine wave changes and thus creates distortion.
* due to, for instance, instantaneous temp changes (low frequencies) or voltage dependent changes due to voltage coefficient.
Jan

You use VDR in audio circuits? interesting🙄
Please stop trolling. Ketje's post was very to the point of the post he quoted.
Jan
A resistor resists the flow of charge, not energy. It is not necessary to amplify in order to distort. Put a non linear resistor in an attenuator and it will happily distort the signal.JonSnell Electronic said:A resistor resists the flow of energy. It does not amplify in any way so a resistor is unable to 'distort'.
I am unclear whether you were intending humour by these strange remarks.
Last edited:
Hello Monte McGuire,
why in the world are you speaking of dBC?
Maybe this is a simple terminology problem. When I say "dBC", I mean "decibels below carrier" level, and not any sort of weighting function. People in the realm of modulation and RF routinely speak of spurious levels relative to the carrier level, which is what I'm talking about, It's a simple way to say that regardless of the signal levels I'm working with, I have a spurious component whose level is 'such and such' dB below the main signal level. I'm not trying to be obscure, but RF folks use dBC a bunch, and I like the idea, so I guess I threw it in here because it makes sense to me. I simply mean "spurious level below the stimulus level". Thanks for asking - terminology needs to be understood!
Now back to that. Why are you bringing up FFT and averaging. You quoted me; I talked about frequency domain that is DFT and or FFT. I also discussed averaging.
You specifically asked for the 'parlor tricks' that could be used to get high resolution measurements with a generator / analyzer having THD+N specs well worse than -120dbC. That's how you do it. I have used these machines for some time, and I wanted to relate the magnitude of the measurements that you can reliably get with these devices, as well as the process and theory of these measurements.
An example: a circuit I've been working on for a while has a noise floor of around -110dB (22kHz BW) but I routinely measure its distortion around the range of -155 and -160dB. It's not hard to get a quality test instrument to "strip away" noise from a THD measurement to allow accurate distortion measurements 40dB into the noise floor. Sure, the generator and analyzer still have to be linear to that degree, but it's really not hard to get rid of the noise and grind down to the actual distortion in the residual.
Now to remake my original point; both Ed and Scott are using a generator with a reported THD + N of -112dB and reporting results as good as -170dB. Their unstated assumption is that the -112dB of generator distortion is isolated in the bridge. At this point I am skeptical. The FFT plots provided by Ed show significant test frequency leaking through the bridge, I am assuming that 2nd and 3rd harmonics are also leaking. Scott did not provide any FFT plots.
While I am unfamiliar with these specific tests (I just received my hardcopy of the Linear Audio issue with that article), I wanted to relate how I have been conducting measurements similar to this for some time using possibly similar gear and techniques.
I am stating that "-112dB THD+N" is mostly noise, and has little to do with nonlinearity. I then described how noise and pure tones behave differently, and that a signal such as the residual of a distortion analyzer could be then processed with an FFT, which would essentially "peel away" the noise from the distortion products in a very predictable and exact manner, allowing the true nonlinearity to be observed reliably, while ignoring a great bulk of the noise contained within the analyzer residual signal.
Again, I cannot comment on their specific test setup, but my suspicion is that they're using a traditional THD generator / analyzer combo, and then taking the FFT of the residual. Audio Precision has sold instruments that can do this for over two decades, and it is a well known technique for separating the actual distortion from the noise floor of a device.
Somebody please post a loopback plot for the 2722 so we can see the 2nd and 3rd harmonics relative to the noise floor.
DT
I'd like to see that too - I don't have a 2722! I do have an APx 555 and an AP2322, and I think I can dig up some plots to show the loopback performance of both. Sometime tomorrow... 🙂
Maybe confusion between capital-C-weighting and dBc.
Although Wikipedia gets it wrong on the other side: DBc instead of dBc in the link... 😉
https://en.wikipedia.org/wiki/DBc
Jan
Although Wikipedia gets it wrong on the other side: DBc instead of dBc in the link... 😉
https://en.wikipedia.org/wiki/DBc
Jan
A further technique is that multiple FFTs can be averaged in the complex frequency domain. When you average N FFTs together, the noise floor effectively drops by 3dB x N.
I misspoke - when averaging FFTs, the noise floor drops by 3dB times the log base two of the number of averages, and not 3dB times the number of averages. So, if you average 8 FFTs, you get 3dB * log2(8) = 3dB * 3 = 9dB less noise. Average 64 FFTs and you get 18dB less noise.
Sorry to be sloppy, but I hope that you'll see this correction.
Good stuff y'all.
When I finish up school next week I'll have a go at it on
an Rohde Schwarz UPD...I can also compare and constrast that
with the AP and a combination of the Shibasoku 725D output
into a QA400.
So if someone has the process that is a step by step procedure,
perhaps some other folks and contribute to the analysis too.
Monte, are you manually getting the numbers from an FFT plot?
Dumping them in a spread sheet and going form there?
Needing shut eye here.
cheers,
I misspoke - when averaging FFTs, the noise floor drops by 3dB times the log base two of the number of averages, and not 3dB times the number of averages. So, if you average 8 FFTs, you get 3dB * log2(8) = 3dB * 3 = 9dB less noise. Average 64 FFTs and you get 18dB less noise.
Sorry to be sloppy, but I hope that you'll see this correction.
You are speaking of averaging apparently lowering of noise floor, I believe, not a reduction in real noise.
It does look like we are talking about terminology.
dBA is A weighted, dBC is C weighted, dBc is dB relative to carrier. Audio Precision uses a label dBr where r means relative to whatever you define it to be. dBFS is full scale based on the upper and lower limits of the analyzer. Then there is dBV where 0 dBV = 1 Volt RMS and dBu where 0 dBu = 0.775 V RMS. To avoid confusion we need to label and be aware of the page that we are on.
There is still confusion between FFT noise floor and total sum of noise across a defined band width.
DT

Last edited:
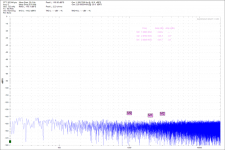
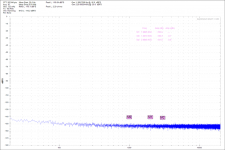
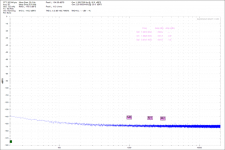
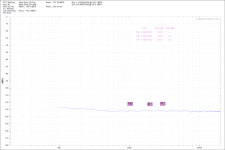
cute little QA401
I have this cute little QA401 sitting here on the floor by me. I thought I would use it to illustrate a couple of things.
https://www.quantasylum.com/content/Products/QA401.aspx
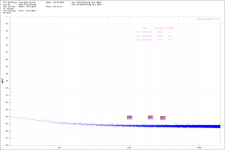
Increasing the number of averages reduces the fluctuation or swing of plus and minus values from the noise floor mean. See the attached plots; 0 averages, 10 averages and 50 averages. Increasing the number of averages does not lower the mean value.
Increasing the sample size increases the number of FFT bins. For every doubling of the sample size the number of bins also doubles with a 3dB reduction in apparent noise floor. As the number of bins increases with sample size, the noise per bin times the number of bins remains equal to total noise. See the attached plots; note that the sample size changes, the noise floor changes by 20 dB and the total RMS noise remains unchanged at -110.0 dB.
DT
I have this cute little QA401 sitting here on the floor by me. I thought I would use it to illustrate a couple of things.
https://www.quantasylum.com/content/Products/QA401.aspx
Increasing the number of averages reduces the fluctuation or swing of plus and minus values from the noise floor mean. See the attached plots; 0 averages, 10 averages and 50 averages. Increasing the number of averages does not lower the mean value.
Increasing the sample size increases the number of FFT bins. For every doubling of the sample size the number of bins also doubles with a 3dB reduction in apparent noise floor. As the number of bins increases with sample size, the noise per bin times the number of bins remains equal to total noise. See the attached plots; note that the sample size changes, the noise floor changes by 20 dB and the total RMS noise remains unchanged at -110.0 dB.
DT
Attachments
Last edited:
My Gosh DT,
You be learning us pretty good there. And I recon I agree with ya'.
'Cause we aren't really changin' the noise floor really as we didn't
do nothin' to begin with.
And I see that you are doing the proper nomenclature also, i.e.;
M0 for the fun-dimental
M1 for the 2nd harmonic
M2 for the 3rd harmonic
It always struck me as funny how the fundamentalist
was Zero while the 2nd harmonic was One
and the 3rd harmonics was two.
I guess it all falls back on the zero, cause that is where
we start. In my not to distant past, before I saw the light
by the professor who whacked my knuckles with a ruler
one too many timw, I put the fundamental
as M1, and the second at M2.
Thank you for settin us straight, that is us unlearned one's
but rest assured I be learning and quickly too.
Cheers,
Hi Sync
Look in the post of "Distortion in Resistors is real". I posted #41, I gave a short overview in resistor linearity. I did not get into super details, however I did talk about my problems in development of the ATS2 and surface mount resistors. Even 25ppm parts are poor in many places.
Duke🙂
Look in the post of "Distortion in Resistors is real". I posted #41, I gave a short overview in resistor linearity. I did not get into super details, however I did talk about my problems in development of the ATS2 and surface mount resistors. Even 25ppm parts are poor in many places.
Duke🙂
Maybe confusion between capital-C-weighting and dBc.
Although Wikipedia gets it wrong on the other side: DBc instead of dBc in the link... 😉
https://en.wikipedia.org/wiki/DBc
Jan
It helps if you remember that dB is deciBel, one tenth of a Bel, a unit named for the Old Man, Alexander Graham Bell (who, like many nembers of this forum, was Scottish, British, American, and Canadian).
https://en.m.wikipedia.org/wiki/Beinn_Bhreagh,_Nova_Scotia
You are speaking of averaging apparently lowering of noise floor, I believe, not a reduction in real noise.
Absolutely! The total noise is unchanged, but the 'trick' is to isolate the noise around each distortion product so that its true level can be more accurately measured (or detected at all).
This is the fundamental problem with a THD+N measurement. If you're measuring a very clean device, it's likely that most of the THD+N residual is noise, and the true level of each distortion product (or even the sum of all distortion spur energy) is well below the total noise level.
By taking the FFT of the residual, the total noise gets split into the available FFT bins, according to the amount of noise that's present over each bin's frequency range. Given that noise behaves like a 'density' vs. frequency, the level in each bin will be less than the total noise, since each bin has only a fraction of the original signal's bandwidth.
Generally, to get a numerically significant result, a signal has to have a level greater than the noise floor, usually by 5 or hopefully 10dB. So, when looking at a transform of a distortion residual, it's still important to see the spur at a level around 5-10dB higher than the level of noise in the adjacent bins to get an accurate number. But, since the FFT, and then possibly also averaging, will push down the level of noise in each bin, it's easier to see a true distortion product, as well as measure it accurately.
Good stuff y'all.
When I finish up school next week I'll have a go at it on
an Rohde Schwarz UPD...I can also compare and constrast that
with the AP and a combination of the Shibasoku 725D output
into a QA400.
So if someone has the process that is a step by step procedure,
perhaps some other folks and contribute to the analysis too.
Monte, are you manually getting the numbers from an FFT plot?
Dumping them in a spread sheet and going form there?
The AP can be set up with a specific 'analyzer' module to digitize and then transform the output of the analog distortion analyzer. The exact details depends on which AP you're using, and which software, but the basic idea is that you set the sample rate and FFT size to determine the FFT frequency bin width and then you can also set the number of averages in some panel or another. You want to use the highest sample rate to get the greatest number of bins, and then you can choose the averaging parameter depending on how long you want to wait.
The APx-555 can do 1M point FFTs, but my old AP2322 can only sample at 48kHz and has less memory for sampled data, so the FFT size is much smaller on that machine.
I take the already transformed and averaged data from a test and export it as a CSV file for my own analysis. However, the interesting 'gotcha' is that the APx-555 has such a fine grained FFT that the exact bin that the fundamental or a harmonic will fall into depends upon the drift of the analog generator vs. the sample rate of the converter that digitizes the residual.
In other words, there are so many FFT bins available that the basic frequency drift of the generator causes the spur energy to fall into one of possibly a handful of FFT bins, preventing me from using a cute script to extract the actual spur energy from a CSV 'dump' of the mega-sample FFT. So, unfortunately, I have to manually look at the bin levels and see which bin has the 'real' spur level.
From what I've seen, the frequency drift seems to be more of a long term thing, and not a short term problem that could scatter the true energy of a distortion spur across several FFT bins during a single measurement - the results seem to be repeatable, but still, the exact bin that a spur should be in is sometimes not where the spur ends up. Examining the analog generator's specs, this 'bin uncertainty' is still within spec. However, it is sort of an annoyance to do this essentially mixed domain measurement with an analog generator and a crystal controlled converter that controls the FFT bin placement.
As an amusing aside, I never noticed this using the old AP2322 since its FFT size was so low that everything 'lined up' without thinking about it. Still, I'm happy to live with this problem of high res FFTs!
This issue is a still a theoretic problem with taking extremely long FFTs and very large numbers of averages. If your system drifts sufficiently, a large FFT/average will not only reduce noise, but will also start to 'rub away' real data due to the drift of the various analyzer components. This is some sort of 'no free lunch' corollary, but it reaffirms the central limit theorem - grind together huge amounts of data and you grind it into a Gaussian. Basically, FFTs and averaged FFTs are not a panacea, but can meaningfully increase measurement resolution if done thoughtfully ;-)
This issue is a still a theoretic problem with taking extremely long FFTs and very large numbers of averages. If your system drifts sufficiently, a large FFT/average will not only reduce noise, but will also start to 'rub away' real data due to the drift of the various analyzer components. This is some sort of 'no free lunch' corollary, but it reaffirms the central limit theorem - grind together huge amounts of data and you grind it into a Gaussian. Basically, FFTs and averaged FFTs are not a panacea, but can meaningfully increase measurement resolution if done thoughtfully ;-)
This problem is solvable in several ways, for one you can create a digital version of a lock-in amplifier via software pre-processing and resampling of your data. Another would be via SRC apparently there is one now that is -140dB THD.
Hi Scott and others,
If y'all wouldn't mind could someone describe
I don't know what these are yet, hopefully they'll address that in my coursework down the road a piece.
Appreciate your (pl. [plural]) time and patience.
@Duke - I found it eventually, for some reason I couldn't find "Distortion in Resistors is Real" Post #41, because that is a sub-heading from another thread,
i.e.; "Distortion in Low Resistance Wirewound Resistors."
I did find it and linked it here, LINK
for anyone following along.
Over linking that is for sure, but it works.
Cheers,
If y'all wouldn't mind could someone describe
- Lock-in amplifier?
- How to do the Digital version of 1 w/software?
- SRC?
I don't know what these are yet, hopefully they'll address that in my coursework down the road a piece.
Appreciate your (pl. [plural]) time and patience.
@Duke - I found it eventually, for some reason I couldn't find "Distortion in Resistors is Real" Post #41, because that is a sub-heading from another thread,
i.e.; "Distortion in Low Resistance Wirewound Resistors."
I did find it and linked it here, LINK
for anyone following along.
Over linking that is for sure, but it works.
Cheers,
Last edited:
Hi Scott and others,
If y'all wouldn't mind could someone describe
- Lock-in amplifier?
- How to do the Digital version of 1 w/software?
- SRC?
I don't know what these are yet, hopefully they'll address that in my coursework down the road a piece.
Appreciate your (pl. [plural]) time and patience.
@Duke - I found it eventually, for some reason I couldn't find "Distortion in Resistors is Real" Post #41, because that is a sub-heading from another thread,
i.e.; "Distortion in Low Resistance Wirewound Resistors."
I did find it and linked it here, LINK
for anyone following along.
Over linking that is for sure, but it works.
Cheers,
There is a post in the low distortion oscillator thread on the first method and one of our members offered info. The second is a sample rate converter to reclock one or the other device. You could probably generate a clock with one channel of a sound card and put the SRC in series with the other, this would take some hardware.
With FFT's remember to correct for the equivalent noise bandwidth if using any window (except rectangular, no window).
http://www.bores.com/courses/advanced/windows/files/windows.pdf
E. Pluribus Unim
Thanks Scott.
Phrase of the day E. Pluribus Unum - one of many, from many come
one, out of many, one; depending on whom we had for a Latin teacher.
I presume you mean it is in the 5,549 post thread, as of the time of my
reply, started by Dennismiller55? At least it's narrowed down to one thread, thanks.
Cheers,
SRC - https://www.google.com/search?q=Electronic+SRC&ie=utf-8&oe=utf-8 Which?
Last edited:
- Home
- Design & Build
- Parts
- Resistor Distortion Measurement