Basically, it involves a view of the spectrogram averaged over a several minutes of the track to see the issues. What you're trying to achieve is a monotonically decreasing spectrogram of frequency SPL (in dB) over the audible frequency range (in dB), so the plot is log-log.
If you remember from physics that almost anything plotted log-log should be a straight line. What you're going to find out that any deviations from a straight line can be seen and corrected. The downward slope of the curve should be -18 dB/decade or about -5.5 dB/octave--established empirically by yours truly.
So it's process of doing a best guess at corrective equalization, apply the EQ curve to the track, view it again, and iterate it to rapidly arrive at an inverse EQ curve to apply. It happens fairly quickly in practice.
Once you establish an approximate straight line response with the right slope, then you use the Spectrogram log(f) view to see the fine tuning of lows, highs, and looking for peaking spectra across the track laterally.
Once you establish the EQ curve, you play the track and listen for final fine tuning. A little ear training helps to identify the problem areas to tweak. Voila!
Each track takes a few minutes at most, or even less if the same EQ curve is used across the album (a good assumption for classical music, but a bad assumption for popular music).
In over 98% of the music tracks, the above process works like a fire hose. In the 2% where it doesn't, there are workarounds that can be used.
Here is a process description for those that aren't very good at building their own EQ curves and use canned XML EQ curves instead...plus the process to de-clip tracks: https://sites.google.com/site/dbrem...ity-xml-files-to-re-equalize-your-music-files
Chris
Last edited:
Anything in last 2-3 years on a label that puts quality first? Or pointers at what I could download for free to look at some of my CDs in comparison. Not sure I trust the spectral analysis on foobar.
BTW I thought Timpani were around 60Hz fundamental?
A short list of existing XML EQ correction files for some popular titles using Audacity:
https://sites.google.com/site/dbremaster/email
Most of the published spectrum charts for the different LF percussion instruments are wrong. You can see it on the spectrograms directly from the tracks themselves. Some timpani lines go lower than 50 Hz, and kick drum fundamentals go to about 30-35 Hz.
https://sites.google.com/site/dbrem...ve-s---audacity-remastering-to-restore-tracks
Chris
...If you remember from physics that almost anything plotted log-log should be a straight line...
Wait... What?
Houston, we have a problem.
Nothing classical there. The beatles was of course mastered originally to play on cheap record players and many cuts were done to find ones that wouldn't skip.A short list of existing XML EQ correction files for some popular titles using Audacity:
https://sites.google.com/site/dbremaster/email
A 25 year old recording used as an example. No research into what the actual spectral content of a symphony orchestra in the listening position is, but some measurements on a kick drum. Not really a coherent article.Most of the published spectrum charts for the different LF percussion instruments are wrong. You can see it on the spectrograms directly from the tracks themselves. Some timpani lines go lower than 50 Hz, and kick drum fundamentals go to about 30-35 Hz.
https://sites.google.com/site/dbrem...ve-s---audacity-remastering-to-restore-tracks
Chris
But I'm game so will download audacity and look at some of my modern classical recordings to see what I can find. I need an excuse to buy this Reference Recordings - RR-136 Detail And as Prof Johnson claims NO compression and NO eq should give us a spectrogram for that size of orchestra in that hall.
Wait... What?
Houston, we have a problem.
No problem. That stray comment was provided for those of you that actually think about things...to munch on. The target curve itself was discovered by empirical means and the observation made after the curve kept reappearing over and over in tracks of the highest quality recordings.
The assumption that makes it true relies on the fullness of the spectral generation from the musicians on average throughout the composition. For orchestras, small ensembles with percussion or bass instruments including rock, jazz and whatever, it turns out to be valid. For unaccompanied solo instruments (including piano) and acapella voice(s), it works a little less well but it still works within the frequency bands of each voice (...do you remember what those frequency bands are?...). Whenever you see a track that doesn't adhere to this target curve, it always sounds "off". Human hearing apparently follows some rules for music: this is but one behavior.
The most effective way to know whether it is true or not is to try it. Remember first that you must do a good job attending to both the slope and the local irregularities of the integrated spectral curve throughout the combined frequency band of the instruments, including their harmonics, and especially in the midrange and lower treble bands...where human hearing is the most sensitive. There, the curve must be effectively flat, without curvature and without local deviations except for the very narrow spectral "spikes" which are effectively integrated into the surrounding spectral magnitudes by the human hearing system.
Chris
Nothing classical there. The beatles was of course mastered originally to play on cheap record players and many cuts were done to find ones that wouldn't skip.
A 25 year old recording used as an example. No research into what the actual spectral content of a symphony orchestra in the listening position is, but some measurements on a kick drum. Not really a coherent article.
But I'm game so will download audacity and look at some of my modern classical recordings to see what I can find. I need an excuse to buy this Reference Recordings - RR-136 Detail And as Prof Johnson claims NO compression and NO eq should give us a spectrogram for that size of orchestra in that hall.
I haven't published an article in a journal. I produced instead some notes for others that want to try it, and some popular resulting XML EQ files for the freeware tool so that those that are most incapacitated musically and technically can try it without actually doing any real work.
Remember, you asked for examples, those were the ones that I had quickly available (and that took some real effort to generate and publish, I might add, without any other reward).
I have thousands of other examples (about 5000 to date and growing daily) that I haven't published, including those of the genre and age that you wished to see. I simply haven't "published" them...and don't plan to anytime soon. The comments and the procedures you find here are only for those that wish to try the remastering processes for themselves.
Nothing here is shall be construed as normative on you personally. Clearly, you don't need any help to do whatever you wish. Only one thing that I ask: it doesn't help me to help you when you are vocally pre-judging the merits until after you try it for yourself, as in the true spirit of DIY.
Chris
Last edited:
I'm not pre-judging. I just asked a question and got a response that was far enough off to be almost orthogonal so pointed this out.
I am still confused as to where the reference curve for an orchestra comes from. Without this its surely just flapping around in the dark until you find a house curve you like? Whilst pop music I can understand is smooshed to death for broadcast I find it tricky to believe that ALL classical recordings and heavily modified. But happy to be enlightened.
I have audacity downloaded now so can have a play with some of the gramaphone 2015 award winners.
A short list of existing XML EQ correction files for some popular titles using Audacity:
https://sites.google.com/site/dbremaster/email
Most of the published spectrum charts for the different LF percussion instruments are wrong. You can see it on the spectrograms directly from the tracks themselves. Some timpani lines go lower than 50 Hz, and kick drum fundamentals go to about 30-35 Hz.
https://sites.google.com/site/dbrem...ve-s---audacity-remastering-to-restore-tracks
Chris
The bass hump and early&steep roll off does not look that dissimilar to the FR of most analogue tape recorders running at 30ips.
Response Curves of Analog Recorders
No problem. That stray comment was provided for those of you that actually think about things...to munch on. The target curve itself was discovered by empirical means and the observation made after the curve kept reappearing over and over in tracks of the highest quality recordings.
Look, no disrespect, but I think you're out in the weeds here. There is no way to derive a target response curve from music recordings. It's music, not pink noise.
Sorry again, but it just doesn't....Whenever you see a track that doesn't adhere to this target curve, it always sounds "off"...
I have tried it, using a few of the curves from your database on some of the matching titles I own. They all just sound dull and weird to me.The most effective way to know whether it is true or not is to try it.
Those "very narrow spectral spikes" are notes! Instruments! Music! Likewise the overall spectral curve. You're herding cats here, dude.Remember first that you must do a good job attending to both the slope and the local irregularities of the integrated spectral curve throughout the combined frequency band of the instruments, including their harmonics, and especially in the midrange and lower treble bands...where human hearing is the most sensitive. There, the curve must be effectively flat, without curvature and without local deviations except for the very narrow spectral "spikes" which are effectively integrated into the surrounding spectral magnitudes by the human hearing system.
Chris
Chris, have you spent any time measuring your speakers, and your room? Because it looks to me like you're trying to fix things from the wrong direction here. I've looked at quite a few of your correction curves, and they really don't make a lot of sense. You've also made a settings error in evaluating the low-frequency spectral energy in your Audacity graphs which has you attempting to repair problems in the low end that simply don't exist. Your FFT size needs to be much larger than 4096 to see what's actually going on down there.
-- Jim
Well audacity is installed and limited myselft to a couple of examples in my lunch break
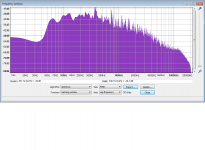
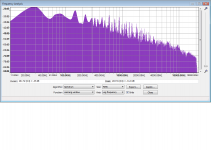
First one is from the end of the first movement of langgaard Symphony 1 on decapo. Second is from a recent Chandos release of fucik (sorry can't work out the accents) and is some triumphal winds combined with lots of timp and cymbals. So is there any obvious signs of tampering here?
@Chris: Open but cynical mind 🙂.
Attachments
I'm not pre-judging. I just asked a question and got a response that was far enough off to be almost orthogonal so pointed this out.
I am still confused as to where the reference curve for an orchestra comes from. Without this its surely just flapping around in the dark until you find a house curve you like? Whilst pop music I can understand is smooshed to death for broadcast I find it tricky to believe that ALL classical recordings and heavily modified. But happy to be enlightened.
I have audacity downloaded now so can have a play with some of the gramaphone 2015 award winners.
I'm a little confused where you got the notion of "house curve". House curves have a very specific origin and use for very large venues that address human hearing (psychoacoustic) and physics issues present there: humidity losses in large amounts of air, reflective properties of far-field room boundaries, seat dip, etc. That notion really isn't apropos for this particular topic. The target response spectrogram (in dB SPL vs. log frequency) is something that is present in the music as it is being played and has nothing to do with a "house curve".
The correction EQ curves discussed above, used to produce near-original target response spectrograms, are "inverse-mastering EQ curves" to approximate the original unmastered response by the musicians. These EQ correction curves vary all over the map...because mastering practices apparently know no physical bounds in the human experience, and if you've seen all the truly awful curves that I had to undo, you'd understand why I have absolutely no regard for the role of "mastering engineer".
Note that it really isn't my responsibility "at the end of the day" to convince you of the reality of the decreasing slope target curve, but I'll give it a try here:
When you listen to white noise played over a sound reproduction system, you'll notice the stridency of its effects. When you instead play pink noise (i.e., "1/f" noise) over the same sound system, you'll notice its stimulating effects to be much more tolerable to your human ears (also see White Noise Definition Vs. Pink Noise - Acoustic Fields). This is a clue to how we wish to hear "music".
The -5.5 dB/octave SPL for a target response music curve (or -18 dB/decade SPL) is simply a measured observation for all high quality recordings that I've measured (...and there are a lot of them I've measured...). There is a mutual relationship to how we also perceive pink noise vs. white noise. This isn't an arbitrary value, but it is presently an empirical one until someone steps forward with the theory that tries to explain the exact decrease-slope dB value.
As far as the mastering curves applied to orchestral music (and classical music in general), these are simply observations made over the entire set of music tracks that I've corrected to date. Since this subject seems to be obviously disconcerting to you personally (for reasons unknown to me that someone would defend the music industry), I'll presently refrain from identifying particular record labels with typical EQ curves. Rest assured, those are available for the recordings that I've "unmastered".
I've found a correlation to nationality of record company and mastering EQ curves typically applied. These curves aren't subtle or anywhere near defensible, so you don't read about them...anywhere. But you can see them applied within mastering tools, and in A-B fashion, you can hear them: they're awful and they make the resulting recordings sound like a table radio.
Try this--it's typical of all classical recordings, even ones that are "award winners" within the past couple of years, and Reference Recordings by Prof. Johnson (RIP):
https://community.klipsch.com/index...no-concerto-20-in-d-minor-k-466/#entry1875943
Remember, there is a large difference between a recording and mixing engineer, and a mastering "engineer". Prof. Johnson wasn't a mastering engineer, to my knowledge.
Chris
By house sound I mean that you seem to have a target spectral response with no reference to the size of orchestra, venue and music type. So you are tweaking until it sounds nice to you. But it may be less accurate than the performance.
You are not disconcerting me, I just am not sure which part of your remastering theory is based on the actual sound in the actual hall.
You are not disconcerting me, I just am not sure which part of your remastering theory is based on the actual sound in the actual hall.
Excuse me for saying this in such a direct way: I believe that you are rearranging the chairs on the deck of the Titanic as it is sinking.
Look closely at the magnitude of the EQ corrections. I believe that, once you try this, all arguments about "which particular venue was this recorded in" will simply fall by the wayside. Those concerns aren't really in the same conversation.
Try it first before commenting on the perceived viability of the approach.
If you have the vinyl phonograph record of this recording, the correction curve will be the same.
Chris
I posted two curves for you to look at. You haven't said if either of them need correcting by your metrics.
Sorry, I missed that particular post (the default pages are very short on this forum).
The second spectrum looks fairly good (as in not EQed to make it sound louder), the first - not so much.
Is the second recording a multichannel one? If so, there is a separate "LFE" channel (the fourth channel) that holds the LF information that is typically left intact by the mastering guys. All of my comments above apply only to 2-channel recordings without LFE. All my multichannel recordings look like that one.
I also recommend opening up the vertical scale a bit to see the issues, as the magnitude of the corrections always looks small when the vertical scale is compressed (like loudspeaker frequency response curves typically posted by manufacturers).
I've found that as you get very close to a target curve, very small corrections then lead to larger perceived differences. This is another clue.
Chris
Look, no disrespect, but I think you're out in the weeds here. There is no way to derive a target response curve from music recordings. It's music, not pink noise...
I have tried it, using a few of the curves from your database on some of the matching titles I own. They all just sound dull and weird to me...
Chris, have you spent any time measuring your speakers, and your room? Because it looks to me like you're trying to fix things from the wrong direction here. I've looked at quite a few of your correction curves, and they really don't make a lot of sense. You've also made a settings error in evaluating the low-frequency spectral energy in your Audacity graphs which has you attempting to repair problems in the low end that simply don't exist. Your FFT size needs to be much larger than 4096 to see what's actually going on down there.
-- Jim
The FR of my front three loudspeakers taken in-room at one metre (the dips in response are non-minimum-phase floor and wall bounce and microphone stand reflections).
An externally hosted image should be here but it was not working when we last tested it.
Here is a look at my physical setup with description. : https://community.klipsch.com/index.php?/user/26262-chris-a/
Phase and distortion plots are also available for each loudspeaker in the 5.2.
What do you own? What do your plots look like? What SPL were you listening at? I listen at concert volume when making corrections.
Most people mistakenly use the correction curves to listen at far reduced SPLs than this - without correcting for loudness (i.e., F-M) effects. All studios that I know use concert volume for mixing, and most for mastering. There is a reason.
Chris
The Fucik is indeed available as SACD, although this is from the redbook layer. I don't have 5.1 capability at home so tend to get the 16/44.1 downloads unless forced to do otherwise. The segment was also extremely lively.
I'll pull some more samples tonight. See what Mahler looks like.
I'll pull some more samples tonight. See what Mahler looks like.
The Fucik is indeed available as SACD, although this is from the redbook layer.
This is interesting. Most PCM layers I've found to be "loudness EQed" on multichannel discs. In fact, I've found that is the main reason why people prefer the DSD/DSF layers instead - because up to about 2 years ago, native DSD was not editable using the DAW software available.
Some of my multichannel jazz SACDs are spectacular simply because the mastering guys couldn't edit the bass tracks to attenuate them. The 6-string jazz bass has an open around 32 Hz, and that is really nice to hear, for instance, the Yellowjackets multichannel SACDs. Highly recommended if you have the bass extension and SACD/DSD reading capability.
Chris
See observation #2 in regard to "dull sounding tracks"...
https://community.klipsch.com/index...e-dr-database-some-observations/#entry1621655
Currently, my spectrogram windows are 8191 samples in length. If I had more available, I'd use it within Audacity. If you have access to longer sampling windows in your DAW software, use it. Since I always listen to my tracks after coarse corrections, the issue isn't a real one - I hear the results and adjust them, then look at the resulting spectrogram plot for confirmation. It's always extremely close audibly to the visual plot.
Chris
Last edited:
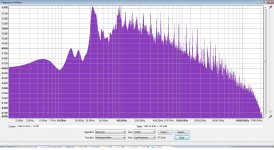
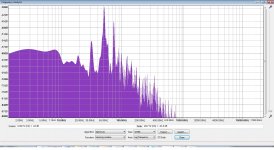
Couple more samples. Full screen this time.
First one is the end of Shostakovitch 5th symphony 4th movement with lots of crash bang wallop. If I am driving audacity right (NOT a given) then lots of power around 30Hz.
For the second, going sublime to rediculous and the first movement of Shostakovitch 2nd which is lotsa p's.
Both on Naxos!
First one is the end of Shostakovitch 5th symphony 4th movement with lots of crash bang wallop. If I am driving audacity right (NOT a given) then lots of power around 30Hz.
For the second, going sublime to rediculous and the first movement of Shostakovitch 2nd which is lotsa p's.
Both on Naxos!
Attachments
- Status
- Not open for further replies.
- Home
- General Interest
- Music
- Rebound in mainstream sound quality from Sonos?