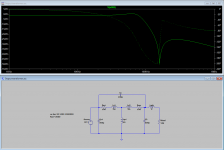
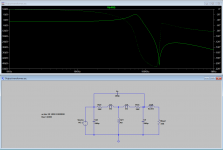
Here's also a quick simulation of a reflected fullrange driver inductance of 0.05mH 8R to 62.5mH on a 10k primary load. The transformer's model parasitics are typical. With and without. You can observe the changes in the FR
Attachments
Last edited:

But the Velleman has only 8 Vpp as max signal out and 8 bit of resolution.I can recommend the Velleman pcsu200 for starters, it traces FR and phase, easy and intuitive interface.
One consideration on the diagram you sent.
The top value is 16 dBv = 6,31 volts.
The curve of Freq. answer is at -20 dB so the signal on secondary loaded ( I suppose) is 0,63 volts
Is it correct?
Can you explain what the problem is with 8Vpp and 8 bit. Why should this be relevant for a bode plot?But the Velleman has only 8 Vpp as max signal out and 8 bit of resolution.
One consideration on the diagram you sent.
The top value is 16 dBv = 6,31 volts.
The curve of Freq. answer is at -20 dB so the signal on secondary loaded ( I suppose) is 0,63 volts
Is it correct?
Hi
just to add some info.
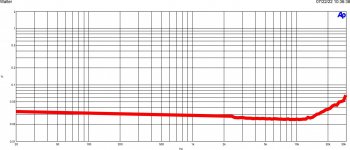
In attach the rsponse frequency of A Sowter s.e. type SF08.
The test set is AP Sys2, scope and a R&S Apn62 generator, one of the best available . It is capable to delivery 20 Vrms out from 1 Hz to 260 kHz and it has the possibility to program the sweep and aslo the Zout continuosly from 10 ohm to 600 ohm then 2kohm.
The trafo in the normal configuration has the primary driven by generator with a 750 ohm ( a value similar to a Rp of a 300B) as Zs; the secondary closed on 8 ohm.
With 20 Vrm I got 890 mV on 8 ohm; is not a proper voltage for test but can be considered enough for this test.
The reverse configuration is a connection of a normal ss amp ( intentionally in this case a simply Aiwa amp, 50 watt) with in series a 8 ohm connected to a secondary of the OT; the primary is close with 750 ohm.
The monitor was with AP and the scope. The signal test are taken in the first test on the 8 ohm load and the reverse on the 750 ohm.
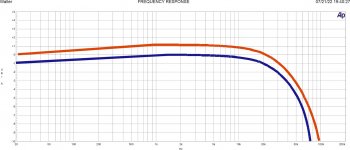
The sweep start at 20 Hz and finish at 200 kHz.
The results in in fig. 1; two curves blu is normal mode , red reverse mode; intentionally they are little bit in a different position, 1 dB just to see the shape; they are perfectly the same with a little changes on the high end due the intervention of ss amp.
Then I measured, at the same level, the THD vs frequency.
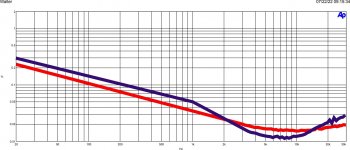
In this case, due the results of the freq. response, I set the sweep from 20 Hz to 50kHz but the end of the graph is 30 kHz; is not necessary to go over.
In fig. 2 the results; in this case the difference is real this because there is the ss amp that has his proper THD even it is a good quality.
For this test a good kit of a ss am with,p.e., 100-150 watt can have a better THD results
In fig. 3 the thd of the ss amp with 8 ohm load; the Thd si reasonable low for the range of frequency involved on the test.
As possible to see that where the Thd has a major impact, with OT outside the amp stage, is on the low frequency part.
This is possible to see in the other diagram I sent in other thread where are involved , in a reverse mode, signal much greater than this one.
As mentioned more the one time the reverse mode can give the possibility to read the performances of OT at many different signal level.
The test involved the s.e. OT but for pp the method is the same; I have done and it is not difficult; the only limitation, as usual, is that due the greater ( normally) ratio of the pp OT the signal comes from standard generator is not enough to have a complete results so the use of the reverse mode can help a lot.
And can give the possibility to use different load on primary ( actin as secondary) to check the differences; of course the range must be evaluated.
I have ready also a proto to use the dc current to check the differences with and without dc in a s.e. trafo but in the pp this aspect is not be considered.
just to add some info.
In attach the rsponse frequency of A Sowter s.e. type SF08.
The test set is AP Sys2, scope and a R&S Apn62 generator, one of the best available . It is capable to delivery 20 Vrms out from 1 Hz to 260 kHz and it has the possibility to program the sweep and aslo the Zout continuosly from 10 ohm to 600 ohm then 2kohm.
The trafo in the normal configuration has the primary driven by generator with a 750 ohm ( a value similar to a Rp of a 300B) as Zs; the secondary closed on 8 ohm.
With 20 Vrm I got 890 mV on 8 ohm; is not a proper voltage for test but can be considered enough for this test.
The reverse configuration is a connection of a normal ss amp ( intentionally in this case a simply Aiwa amp, 50 watt) with in series a 8 ohm connected to a secondary of the OT; the primary is close with 750 ohm.
The monitor was with AP and the scope. The signal test are taken in the first test on the 8 ohm load and the reverse on the 750 ohm.
The sweep start at 20 Hz and finish at 200 kHz.
The results in in fig. 1; two curves blu is normal mode , red reverse mode; intentionally they are little bit in a different position, 1 dB just to see the shape; they are perfectly the same with a little changes on the high end due the intervention of ss amp.
Then I measured, at the same level, the THD vs frequency.
In this case, due the results of the freq. response, I set the sweep from 20 Hz to 50kHz but the end of the graph is 30 kHz; is not necessary to go over.
In fig. 2 the results; in this case the difference is real this because there is the ss amp that has his proper THD even it is a good quality.
For this test a good kit of a ss am with,p.e., 100-150 watt can have a better THD results
In fig. 3 the thd of the ss amp with 8 ohm load; the Thd si reasonable low for the range of frequency involved on the test.
As possible to see that where the Thd has a major impact, with OT outside the amp stage, is on the low frequency part.
This is possible to see in the other diagram I sent in other thread where are involved , in a reverse mode, signal much greater than this one.
As mentioned more the one time the reverse mode can give the possibility to read the performances of OT at many different signal level.
The test involved the s.e. OT but for pp the method is the same; I have done and it is not difficult; the only limitation, as usual, is that due the greater ( normally) ratio of the pp OT the signal comes from standard generator is not enough to have a complete results so the use of the reverse mode can help a lot.
And can give the possibility to use different load on primary ( actin as secondary) to check the differences; of course the range must be evaluated.
I have ready also a proto to use the dc current to check the differences with and without dc in a s.e. trafo but in the pp this aspect is not be considered.
Attachments

Last edited:
Why does the first plot only extend to -10dB - did you go to the 260kHz limit of the generator and can you report that?
Why didn't you just present results for 2nd plot out to 50kHz ? It just suggests that you are censoring the result. Are you also saying that your reverse test setup had THD limitations - does that mean you have prepared and used a better setup but just not wanting to report it?
I can't comprehend what you are saying with respect to the 3rd plot (and beyond to the end of the post) - maybe it's a lack of scientific rigour, and maybe it is a difficulty with english.
Please,
try to do this test by yourself with the adeguate set up, if you are able.
Then we can discuss your results compared with mine
It is too simply to always criticize.
And where I said the reverse mthod had limitation?
try to do this test by yourself with the adeguate set up, if you are able.
Then we can discuss your results compared with mine
It is too simply to always criticize.
And where I said the reverse mthod had limitation?
Just for info the diagram published are the results of around 6 hrs of job to find the right setting of sweep and level.
Checking the results first in a fix level then variable, with ripetitive runs.
And it is evident that after fixed the procedure the best diagram are published.
What do you think to see after -10dB at 80 kHz, the phantoms?
Checking the results first in a fix level then variable, with ripetitive runs.
And it is evident that after fixed the procedure the best diagram are published.
What do you think to see after -10dB at 80 kHz, the phantoms?
Hi walter,Hi
just to add some info.
In attach the rsponse frequency of A Sowter s.e. type SF08.
The test set is AP Sys2, scope and a R&S Apn62 generator, one of the best available . It is capable to delivery 20 Vrms out from 1 Hz to 260 kHz and it has the possibility to program the sweep and aslo the Zout continuosly from 10 ohm to 600 ohm then 2kohm.
The trafo in the normal configuration has the primary driven by generator with a 750 ohm ( a value similar to a Rp of a 300B) as Zs; the secondary closed on 8 ohm.
With 20 Vrm I got 890 mV on 8 ohm; is not a proper voltage for test but can be considered enough for this test.
The reverse configuration is a connection of a normal ss amp ( intentionally in this case a simply Aiwa amp, 50 watt) with in series a 8 ohm connected to a secondary of the OT; the primary is close with 750 ohm.
The monitor was with AP and the scope. The signal test are taken in the first test on the 8 ohm load and the reverse on the 750 ohm.
The sweep start at 20 Hz and finish at 200 kHz.
The results in in fig. 1; two curves blu is normal mode , red reverse mode; intentionally they are little bit in a different position, 1 dB just to see the shape; they are perfectly the same with a little changes on the high end due the intervention of ss amp.
Then I measured, at the same level, the THD vs frequency.
In this case, due the results of the freq. response, I set the sweep from 20 Hz to 50kHz but the end of the graph is 30 kHz; is not necessary to go over.
In fig. 2 the results; in this case the difference is real this because there is the ss amp that has his proper THD even it is a good quality.
For this test a good kit of a ss am with,p.e., 100-150 watt can have a better THD results
In fig. 3 the thd of the ss amp with 8 ohm load; the Thd si reasonable low for the range of frequency involved on the test.
As possible to see that where the Thd has a major impact, with OT outside the amp stage, is on the low frequency part.
This is possible to see in the other diagram I sent in other thread where are involved , in a reverse mode, signal much greater than this one.
As mentioned more the one time the reverse mode can give the possibility to read the performances of OT at many different signal level.
The test involved the s.e. OT but for pp the method is the same; I have done and it is not difficult; the only limitation, as usual, is that due the greater ( normally) ratio of the pp OT the signal comes from standard generator is not enough to have a complete results so the use of the reverse mode can help a lot.
And can give the possibility to use different load on primary ( actin as secondary) to check the differences; of course the range must be evaluated.
I have ready also a proto to use the dc current to check the differences with and without dc in a s.e. trafo but in the pp this aspect is not be considered.
Why didn't you answer my question first why 8Vpp is not enough?
Even in your own test you say that 20Vrms is barely enough, what is your explanation for that. Do you have a theory for that?
About the Sowter test, I don't believe the results you publish here. Take a look at the results that Sowter himself presents: https://www.sowter.co.uk/specs/sa08.htm
My first impression is that with a transformer with only 25H your results cannot be correct, also Sowter uses Audio Precision.
Looking at the Sowter (at there own website), not bad, not good but a lot better then a Fiat transformer
btw an Aiwa amplifier? Dos this amplifier can drive a reverse transformer at 1Hz till 260kHz? No way ofc.
Last edited:
Yes resonances, you clearly like to avoid them. I doubt the Sowter has many problems but what i have seen of your Fiat transformers i am sure they have many .Just for info the diagram published are the results of around 6 hrs of job to find the right setting of sweep and level.
Checking the results first in a fix level then variable, with ripetitive runs.
And it is evident that after fixed the procedure the best diagram are published.
What do you think to see after -10dB at 80 kHz, the phantoms?
Try to give some square waves 10kHz and do that with a really good frequency generator capabel of 10MHz or 20MHz. Plenty available nowadays for very low prices (200-1000 euro) The +10000 AP is not so good at HF
NO 8Vpp as drive signal in not enough to have a complete verification.
The last test with 20 Vrms is to show with a unique source but different method.
The Ap can't allow to reach the 20 Vrm for the full range of frequency; in fact the Sowter used arounnd 9 volt for his test.
That's all but , as usual, you haven't understood. Remember the E88C and the calculation of gain?
I have a theory learned on the book ( new and old) and test lab that I normally show
I suspect that you don't; but you can still continue with signal of 80 mV.
Please try to show us your test with same test set, maybe better. And you beautiful stuff.
Then we can discuss, as told you other time.
Regarding differences on freq answer I repeat many times the test and I have got always the same results.
But is not a problem.
As you see the reverse mode is working fine.
But this not the end.
Last edited:
Okay Walter Gentilucc you are a liar again, for the 4-5-8-X time? (I did not used a input signal of 80mV)NO 8Vpp as drive signal in not enough to have a complete verification.
The last test with 20 Vrms is to show with a unique source but different method.
The Ap can't allow to reach the 20 Vrm for the full range of frequency; in fact the Sowter used arounnd 9 volt for his test.
That's all but , as usual, you haven't understood. Remember the E88C and the calculation of gain?
I have a theory learned on the book ( new and old) and test lab that I normally show
I suspect that you don't; but you can still continue with signal of 80 mV.
Please try to show us your test with same test set, maybe better. And you beautiful stuff.
Then we can discuss, as told you other time.
Regarding differences on freq answer I repeat many times the test and I have got always the same results.
But is not a problem.
As you see the reverse mode is working fine.
But this not the end.
The e88c story has nothing to do with this, I was just sloppy. And I even apologized for that. You never apologized for the fact that your measurements with your transformers and your explanations were all wrong. That makes you a bad person.
You really don't understand transformer theory and you still think that a certain amount of output is necessary. Wrong!
You have given no evidence for your "theory" . ALL measurements of the transformers you measured indicate that you are incorrect .
Your latest about the Sowter... horrible wrong
Last edited:
One additional note
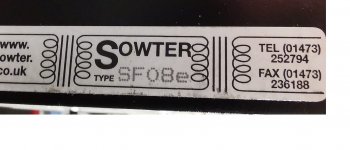
The my Sowter on test SF08, not SA08.
My typo error.
The difference is the wire on secondary; the SF08 ha 0-4-8 ohm while the SA08 has a multiple secondary. The other spec are the same.
And, maybe, I have understood the difference in freq. answer. I will ask to Brian Sowter a confirmation.
ps= https://www.jensen-transformers.com/wp-content/uploads/2014/08/Audio-Transformers-Chapter.pdf
chapter 1.3.1 Maxim um Signal Level, Distortion, and Source Impedance
also fig. 18, A distortion with 0dBu ( 0,77 volt) and Zs = 40 ohm with M6 steel (as Sowter) gives the shape of thd same as mine but ( of course) at different level and Zsource.
so the phrase in this chapter
"But in a real transformer design there is a fixed relationship between
signal level, distortion, and source impedance"
is esplicative.
Attachments
Last edited:
Walter,
.
You may not have noticed that your transformer is SE and that fig 18 is not for SE.
That means the magnetic loop behaves differently, the shape of the loop is different and the core is pre-magnetized. Until you understand that this is different, you will not be able to make your measurements correctly.
Almost all the distortion, if you are going to work with large signals, that you will have in an SE amplifier is not from the transformer but from the tube
Waltube, I appreciate your effort, yet IMHO there are several things that mixed together into inedible cocktail.NO 8Vpp as drive signal in not enough to have a complete verification.
The last test with 20 Vrms is to show with a unique source but different method.
The Ap can't allow to reach the 20 Vrm for the full range of frequency; in fact the Sowter used arounnd 9 volt for his test.
1) For frequency response plot (subject of this thread), you don't need much voltage from generator, most abnormalities occur at high frequency range due to leakage inductance and stray capacitance. LF characteristics are defined by core cross-section, primary turns, Bmax Bmin = f(permeability), and if transformer designed correctly, its better to measure (LF) in real assembled amplifier.
2) Backward connections may have sense only for THD measurement, and here is why. THD of transformer is a function of B (flux density) and so called distortion coefficient of the core (a material properties). Its quite problematic to get 400 - 600V RMS out of generator, so backward connections may solve this problem. For 60W only ~22V are required on secondary 8 Ohm tap. I may dig deeper into this subject yet its not required since modern magnetic materials have so low impact that it can be neglected, its a waste of time doing this kind of tests.
Waltube, I appreciate your effort, yet IMHO there are several things that mixed together into inedible cocktail.
1) For frequency response plot (subject of this thread), you don't need much voltage from generator, most abnormalities occur at high frequency range due to leakage inductance and stray capacitance. LF characteristics are defined by core cross-section, primary turns, Bmax Bmin = f(permeability), and if transformer designed correctly, its better to measure (LF) in real assembled amplifier.
2) Backward connections may have sense only for THD measurement, and here is why. THD of transformer is a function of B (flux density) and so called distortion coefficient of the core (a material properties). Its quite problematic to get 400 - 600V RMS out of generator, so backward connections may solve this problem. For 60W only ~22V are required on secondary 8 Ohm tap. I may dig deeper into this subject yet its not required since modern magnetic materials have so low impact that it can be neglected, its a waste of time doing this kind of tests.
I can be agree with you about the frequency answer even it is interesting to check the results from a low signal to the max permissible .
Then , what I have specified ( more than one time) is the THD vs. Frequency as major test to understand the performances of the OT alone outside from amp.
After the verification that the reverse method is a good test we can check the results of the trafo itself for different level.
Regarding the fact that these test aren't so interesting everyone can decide to do or not.
But with a simple set up ( sound card, sw as Arta or Rew, few resistor and an attenuator and a ss amp) the job is not so complicated
No Walt, again, if you understand the transformer theory, you can't measure SE transformer THD that way. You MUST use a pre-magnetization otherwise your measurement is completely wrong. You MUST also measure with the equivalent Ri of the tube you are using. Capito? So that means your backward method circuit is wrong from the start and Timpert already showed you that in a different thread.
I agree with Linuksguru, you are wasting your time,
"I can be agree with you about the frequency answer even it is interesting to check the results from a low signal to the max permissible"
If you want better information about the transformer it is better to use the lower signals. The max is important but less
Last edited:
Without tubes such tests are almost useless ...
I bet a normal power transformer will also test pretty good .
I bet a normal power transformer will also test pretty good .
Without tubes such tests are almost useless ...
I bet a normal power transformer will also test pretty good .
Please explain why.
In which way you can get a wide range of information about the OT trafo?
Some other info.
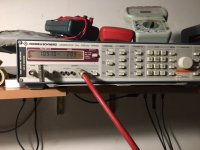
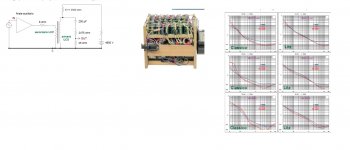
In attach the first test set done by my collegue Fabrizio around the test with reverse mode for a s.e. OT.
Having a power supply at 4900 volts used by Feabrizio for other things he used it acting as current source to delivery current to the primary of a s.e. trafo.
There is also the phot of the entire power supply
I understand that is a little complicated ( and dangerous, of course)
Then the results of two proto of trafo with different curretn; the test is THD vs Freq.
About Freq. answer the difference are little.
The load on primary was 2500 ohm.
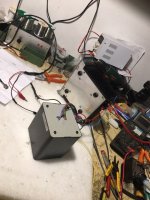
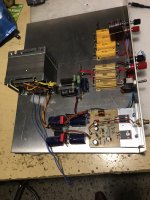
Then I have built a proto to have a less complicate set up to have the dc current involved.
In attach the photo ( I sent it in another thread) of the proto
Done some time ago, the firsts test were fine but something better are to do in next future.
There is a ss power amp, good performances, 120 wrms ( about); some dummy resistors; some connector to chenge the test set.
It is missing a variable pwer supply that can delivery current to the secondary of the OT acting as current source.
Now I am in holiday for the half of a year and the lab is working randomly.
When the final test will be done and are ripetitive I will show something.
For pp, of course, this setup is not necessary; the dc power supply is omitted ( the proto has the proper switch)
In attach the first test set done by my collegue Fabrizio around the test with reverse mode for a s.e. OT.
Having a power supply at 4900 volts used by Feabrizio for other things he used it acting as current source to delivery current to the primary of a s.e. trafo.
There is also the phot of the entire power supply
I understand that is a little complicated ( and dangerous, of course)
Then the results of two proto of trafo with different curretn; the test is THD vs Freq.
About Freq. answer the difference are little.
The load on primary was 2500 ohm.
Then I have built a proto to have a less complicate set up to have the dc current involved.
In attach the photo ( I sent it in another thread) of the proto
Done some time ago, the firsts test were fine but something better are to do in next future.
There is a ss power amp, good performances, 120 wrms ( about); some dummy resistors; some connector to chenge the test set.
It is missing a variable pwer supply that can delivery current to the secondary of the OT acting as current source.
Now I am in holiday for the half of a year and the lab is working randomly.
When the final test will be done and are ripetitive I will show something.
For pp, of course, this setup is not necessary; the dc power supply is omitted ( the proto has the proper switch)
Attachments
Last edited:
- Home
- Amplifiers
- Tubes / Valves
- Q: Measuring Frequency Response of PP Output Transformer