Hi !
I have some difficulty to evaluate output tube dissipation power. KT88, 455V B+, 85mA idle current, ~38.7 power.
In LTSpice model I(anode) shows peak 330mA. How max anode dissipated power not exceeding 42W?
What am I missing in this particular case?
Thanks in advance.
I have some difficulty to evaluate output tube dissipation power. KT88, 455V B+, 85mA idle current, ~38.7 power.
In LTSpice model I(anode) shows peak 330mA. How max anode dissipated power not exceeding 42W?
What am I missing in this particular case?
Thanks in advance.
Attachments
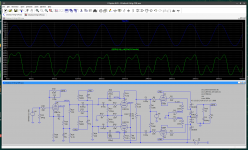
Peak current happens when the anode voltage goes down. Plot in LTSpice (anode voltage - cathode voltage) * anode current.

And that peak dissipation will exceed 42 watts. Semiconductors are subject to instantaneous VI limitations, tubes are not. You only need to worry about maximum average plate dissipation - about B+/(2.5*Ra-a) - or the idle dissipation, whichever is greater.
Peak g2 dissipation limits are sometimes given, and should be respected. Those fine wires heat up fast.
Peak g2 dissipation limits are sometimes given, and should be respected. Those fine wires heat up fast.
Hi
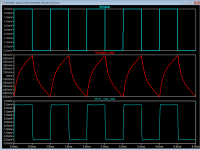
It might be easier to visualise in LTspice if while running the sim you mouse over the tube in question while holding down the alt key you should get a thermometer icon, left click and you will get a power trace, right click over the waveform and "add plot pane" then click on the tube anode wire to obtain an anode voltage plot (pencil icon) , right click over the waveform and "add plot pane" , then click on the tube cathode wire to obtain a cathode current plot (amp clamp tester icon). You can see the power at any instant in time with respect to voltage and current.
By clicking on the text above each waveform while holding down the Ctrl button LTspice will give average and integral.
I don't mean to teach you how to suck eggs, you may be better at LTspice than I am, this may however benefit somebody.
I recently did a post on RIAA and used multiple plot planes, I will repost that image here (as an example of multiple plot panes) it shows square wave into RIAA preamp, preamp output and the Inverse RIAA back to hopefully show close to the original waveform.
Attachments
You should make a distinction between average power and peak power.
It may well be that with signal, dissipation peaks get above the max, but the tube max spec is for avergae power.
If you want to check it in LTspice, set the signal source to zero (or very small like 1mV) and see what the power is.
is this class A or AB?
Edit - I see that Tubekwk makes a similar point.
Jan
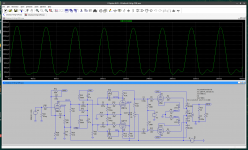
Thanks, that's what I finally did. Plot attached.Peak current happens when the anode voltage goes down. Plot in LTSpice (anode voltage - cathode voltage) * anode current.
Attachments
Now press Ctrl key and left click on the power formula in green. You should get a small window showing the average anode dissipated power.Thanks, that's what I finally did. Plot attached.
If you want the total tube dissipation, then you have to add to that equation the screen dissipation in a similar way.
- Home
- Amplifiers
- Tubes / Valves
- Q: KT88 PP Dissipation Power Calc