I haven't had much experience with time aligning drivers though. Is it really as valuable as people make it out to be? To me it seems that proper crossover design with a second order and close driver proximity gives many benefits in excursion/distortion and lower crossover point without too many downsides. Sorry for my sidetrack haha just Interesting stuff to me. Feel free to ignore me and carry on with the intended purpose of the thread lol
Time alignment makes a world of difference. If you can make a transient perfect speaker (very rare in commercial world of speakers) it will sound more realistic with percussion such as piano, drums, plucked strings. Once you hear it, you will realize you can't go back to not.
More info here:
http://www.diyaudio.com/forums/multi-way/88135-filler-driver-ala-b-o.html
http://www.diyaudio.com/forums/multi-way/277691-s-harsch-xo.html
Look at step response of Dunalvy SC-IV:
Dunlavy Audio Labs SC-IV/A loudspeaker Measurements part 3 | Stereophile.com
An externally hosted image should be here but it was not working when we last tested it.
Compare to the well regarded B&W 802D:
B&W 802D loudspeaker Measurements | Stereophile.com
An externally hosted image should be here but it was not working when we last tested it.
Which do you think has more realistic percussion?
Well 100db at 1/2 meter would be 94db at 1m which corresponds to about 6 watts so that might be pushing the 5 watt rating a little but 95db would most definitely be fine.
And interesting that your drivers are supposed to lose sensitivity. Do you have any data on the range of sensitivities or Thiele small parameters for the drivers you get in? 2 or 3 db seems pretty significant to be manufacturer tolerances...
And interesting that your drivers are supposed to lose sensitivity. Do you have any data on the range of sensitivities or Thiele small parameters for the drivers you get in? 2 or 3 db seems pretty significant to be manufacturer tolerances...
Attached is the last batch of 20. Data is measured with S+L WT2. Each driver is measured twice in succession and the 2nd result used. This batch is closer then most (Fostex).
You can see that the range of sensitivities is just over 1 dB.
Sorted by sensitivity.
dave
You can see that the range of sensitivities is just over 1 dB.
Sorted by sensitivity.
dave
Attachments

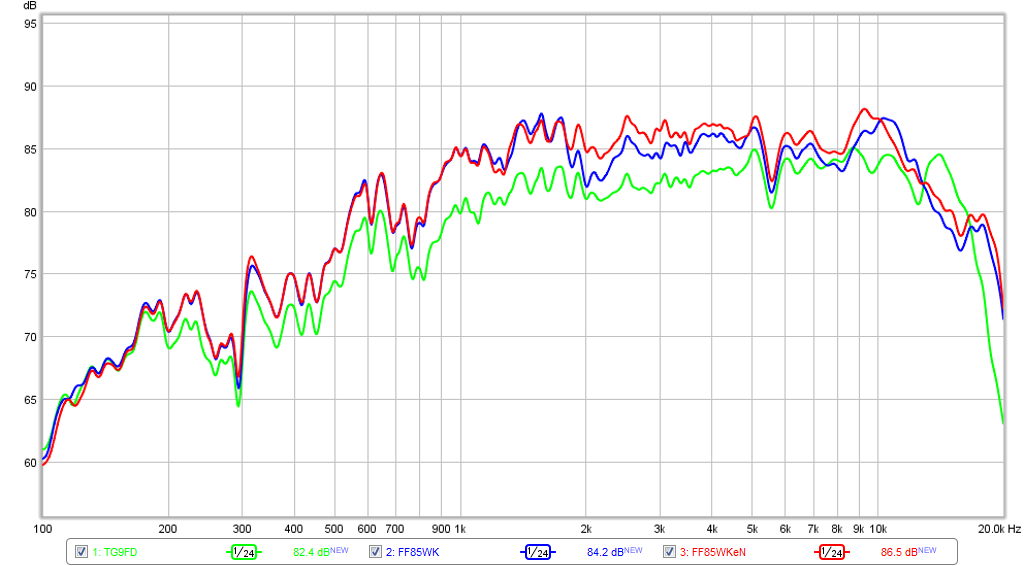
The TG9FD10-8 spec says 84.1dB at 2.83v. If we look at the measurement with all 3 we can see that the TG9FD10-8 indeed sits about 4-5dB below the FF85WK and eN from 1kHz to 1.7kHz. It would appear that above 1.7kHz is where the eN treatment really starts to lift the response up by 1.0dB to 1.5dB even. A significant change that would almost place it in the 90.5dB category sensitivity.
Last edited:
P10 said "The treatment decreases sensitivity by a small amount."
I think we all expected this to be the case but interestingly it was not. Could there be another reason for the lift?
Additionally, the comments by X regarding time alignment are interesting because my 12lta plus compression driver (mounted in a horn) set the tweeters further back than simply mounting a dome on a baffle. I wonder if this is an example of time alignment (even tho it was not my intention). Percussion, plucked strings and piano are great with this system compared to my other DIY efforts (none of which are time aligned). I always attributed this to using Pro Sound drivers. Am I off base here?
P10 said "The treatment decreases sensitivity by a small amount."
I think we all expected this to be the case but interestingly it was not. Could there be another reason for the lift?
Additionally, the comments by X regarding time alignment are interesting because my 12lta plus compression driver (mounted in a horn) set the tweeters further back than simply mounting a dome on a baffle. I wonder if this is an example of time alignment (even tho it was not my intention). Percussion, plucked strings and piano are great with this system compared to my other DIY efforts (none of which are time aligned). I always attributed this to using Pro Sound drivers. Am I off base here?
No, you are not - it's one reason why coaxial PA speakers sound really good with percussion. The CD is mounted behind the woofer magnet and that setback provides a natural time alignment. I have actually measured a close-to-transient perfect right triangle SR from my Beta8cx with a CD, when I was not working very hard to time align it.
EnABL is supported by a number of (undocumented) blind & double-blind tests.
Why were the trials not documented? It seems silly to go through the trouble of setting up a scientifically valid experiment, performing the experiment, recording the results, and compensating the 250 participants for their time only to stuff the results in a desk drawer somewhere to be forgotten.
With a calibrated microphone one can measure a wide range of parameters of the driver before and after the dots have been applied and quantify the difference. There has to be some difference. After all, the moving mass of the diaphragm is changed by adding the dots. I would also guess that the dots could change the cone break-up characteristics slightly. These guesses could quickly be tested by measuring the Thiele-Small parameters and the frequency response of the driver. It would be interesting to see if there were significant changes in the THD and IMD of the driver as well. I would encourage those measurements to be added to the frequency response shown above.
I like the dots. I think they're pretty. In like with the original poster, I'm curious to see their effect quantified.
Tom
If we look at the measurement with all 3 we can see that the TG9FD10-8 indeed sits about 4-5dB below the FF85WK and eN from 1kHz to 1.7kHz. It would appear that above 1.7kHz is where the eN treatment really starts to lift the response up by 1.0dB to 1.5dB even. A significant change that would almost place it in the 90.5dB category sensitivity.
Also note the hump at 10 kHz shifting down in frequency with the dots added.
Interesting work. Have you looked at the THD and IMD by any chance?
Tom
Also note the hump at 10 kHz shifting down in frequency with the dots added.
Interesting work. Have you looked at the THD and IMD by any chance?
Tom
The harmonic distortion is shown above but not IMD. I think it's page 20
The harmonic distortion is shown above but not IMD. I think it's page 20
Cool! Interesting with the play between H2 and H3 in the 3-6 kHz region. I like the smoother THD of the dotted driver, though the difference is pretty slight.
How repeatable are the results?
Tom
I have never done an IMD measurement on a speaker. I think I can set up a dual test tone - say 1khz and 1.5khz and then look at the RTA plot? Does REW have built in IMD test utility?
Member
Joined 2009
Paid Member
Yes, interesting. Improved freq response in that freq range indicates to me that a wave reflection null from the impedance mismatch at the cone/surround interface has been reduced. That's my theory anyway, and it makes sense given that IIRC the basic rationale of enable dots is to improve wave termination at the edge of the cone.
were there any other cone treatments applied - i.e. some sticky stuff on backside of cone near surround ? was there a coating applied all over the cone ? - the dots pattern is only the last item usually from what I remember but Dave knows the details of what he did with those drivers.
With very small changes do you need a control sample, at least to see sample-to-sample variation, or variation with ambient humidity and temperature ?
Last edited:
The response from 1.4kHz - 11kHz is pretty flat for the treated driver. I want to know which tweak causes the beneficial lift in response from approx 2kHz upward.
I have never done an IMD measurement on a speaker. I think I can set up a dual test tone - say 1khz and 1.5khz and then look at the RTA plot? Does REW have built in IMD test utility?
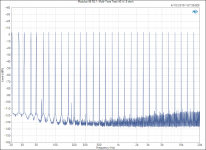
I'm not familiar with REW and don't really know what to expect from the IMD plot either. I'd run either a dual tone or a multi-tone (AP uses a 32-tone signal from 16 Hz to 20 kHz with tones spaced evenly on a log scale). You then look at the "grass" growing towards the higher end of the spectrum. I can email you a test tone if you're interested. You'd need an FFT or spectrum analyzer tool to measure the output.
Attached graph is from my Modulus-86 power amp. Just to give you an idea of what a Multitone measurement looks like.
Many argue that single-tone measurements aren't reflective of actual music signals. I think they have a valid point. A multi-tone IMD test is probably more likely to pick out differences between two systems. That's my rationale for using them anyway.
Tom
Attachments
Why were the trials not documented? It seems silly to go through the trouble of setting up a scientifically valid experiment, performing the experiment, recording the results, and compensating the 250 participants for their time only to stuff the results in a desk drawer somewhere to be forgotten.
Because they weren't. The tests were informal but valid. It was mostly for the benefit of those doing the comparison.
It would take a lot more effort & money to do them in such a manner as to document them.
I may set up another test for diyFEST this summer (i have the speakers done)
dave
I'm not familiar with REW and don't really know what to expect from the IMD plot either. I'd run either a dual tone or a multi-tone (AP uses a 32-tone signal from 16 Hz to 20 kHz with tones spaced evenly on a log scale). You then look at the "grass" growing towards the higher end of the spectrum. I can email you a test tone if you're interested. You'd need an FFT or spectrum analyzer tool to measure the output.
Attached graph is from my Modulus-86 power amp. Just to give you an idea of what a Multitone measurement looks like.
Many argue that single-tone measurements aren't reflective of actual music signals. I think they have a valid point. A multi-tone IMD test is probably more likely to pick out differences between two systems. That's my rationale for using them anyway.
Tom
That's a really cool test! I'd actually been looking for something just like that multitone test to test the amp I'm building
From a pure scientifical point of view from these test we can only say that a Planet 10 treated version of this driver measures better and there for should sound better than the factory pristine driver. Although, this doesn't prove or disprove the Enb-effect since there are more tweaks than Enb treating in play.
Which mod affect the most?
We don't know.
Which mod affect the most?
We don't know.
All:
There appears to be a measurable difference in increased sensitivity and smoothness with the eNabled one. This will obviously, be audible in my opinion.
It is strange that making the cone heavier is not decreasing sensitivity. All else being the same, a heavier cone should result in lower sensitivity, right? Can you measure your second pair of drivers also?
Also, you can see that many of the bumps and troughs are the same in all three drivers. These are not driver resonances, but reflections created due to the setup. For example, the series of bumps from about 1.4 kHz to 2 kHz, the dip at 5.5 kHz, etc. There are others. Note that the bump around 9 kHz is only in the two Fostex drivers, so that one is not setup related.
To my eyes, other than the shelf above about 2 kHz, there is almost no difference between the two Fostex drivers. But this difference will be audible and I'm not sure this pair of drivers lends itself to a good comparison of the effects of "enable."
I was originally under the impression that the only thing the "enabled" driver will have is the dots. If it has other mods, such as damping the cone, and doing things to the surround, frame, etc., then it is not considered simply "enabling" and in which case, we should ask whether it should be part of the test for the audibility of the "enable" method.
All else being the same, a heavier cone should result in lower sensitivity, right?
Yes.
Now unless measured during the same session (or exactly the same conditions, weather for most of us) T/S are not directly comparable. But, X's treated drivers measured 87.58 dB, the same drivers stock (measured 2 weeks earlier) 88.24 dB.
EnABLing is the spots + the conformal coating.
The other mods (except for ZIG which is "recent") i have been doing for decades.
dave
- Status
- Not open for further replies.
- Home
- Loudspeakers
- Full Range
- Planet 10 measured improvements? FF85wk