Salas, yes you are correct in your post that I am seeking for understand what the zig zags represent and what to watch for.....And absolutely, this has turned into a nice discussion, however, much of it is Greek to me, but I am willing to learn to understand........What I am attempting to accomplish with the FRD spreadsheet with my simulations along with a lot of listening, are tweaks to finetune my sound.....Having an understanding of what many of the Frequency Response Charts represent, I am able to continue to fine tune as I relate what the speakers actually sound like to my Response charts.......But in the matter of Phase......I am clueless, and have no understanding on how to interpret the phase charts that are generated with each simulation I produce........The thing that concerns me is that I feel that I may be missing some important aspects of my crossover design, because I don't know how to interpret the Phase charts, thereby giving me no more information to work with.....Tom Danley.....Can you clarify what you mean by summed mag and phase as a 3 row text file?...And what you mean by unwrapping it and taking a guess......I can save most of these files as FRD and ZMA files, and I would be delighted to give you a shot, However I would also like to learn how to interpret my phase charts as well.........Thank you all for the input you have provided so far, and I look forward to learning more...............Omni
Omni, think about this explanation for a bit.
If one makes a passive filter consisting of a high pass and low pass filter, one has a band pass, like a loudspeaker driver.
That filter, if measured, has a phase response which corresponds directly to the magnitude response.
An example;
http://srforums.prosoundweb.com/index.php/fa/8723/0/
In this minimum phase system one simply cannot change amplitude without a corresponding change in phase.
In this case, if the filters response were not totally flat, Eqing the filter to be “flat” fixes both magnitude and phase. Here EQ is an exact fix for both mag and phase “literally perfect”. Yes there is a problem because often what you want to fix with EQ is a result of reflected sound and then EQ is totally wrong, these problems are deep dips / Notches and cannot be fixed, trying to screws up the phase even if the amplitude looks better.
Anyway, to the first order, a speaker driver is also at least mostly minimum phase and so has an acoustic phase response related to its amplitude response..
The extreme complication is that if one is talking about measuring a loudspeaker, one also has a phase shift proportional to the time delay between the electrical signal entering the driver and when it arrives as pressure at the microphone.
Not accounting for all of that delay or having an “all pass like” phase shift in band makes the phase trace wrap around the display like the one starting this thread.
In this thread, the last several posts have a more in depth discussion of time and the last post shows the difference in phase that having a tiny time error causes.
http://srforums.prosoundweb.com/index.php/mv/msg/22292/0/40/16795/
As some measurement systems have a phase plot but do not measure acoustic phase and for what I was working on I needed to get real acoustic phase, I came up with a simple reality test that could show if it’s a real Poncho or a Sears Poncho (apologies to Frank Z)
That filter set plus a time delay can be used as a “perfect” noise free speaker with exactly known slopes in mag and phase.
If a measurement system can’t find the “speaker” in time and resolve its real phase response one typically finds the slopes are wrong and phase shift is wrong on the side bands.
Humorously there have been several magazine articles about using all pass filters to “fix” the rising phase condition, when in reality, it is a measurement error a result of not having all the fixed delay accounted for.
If one looks at the Group delay plot above, one finds the time connection to where Time = zero.
Anyway, not familiar with FRD or Zma files, what I meant by text file is that if you can save that as a .Txt file that is arranged in three columns,
Frequency -space- Magnitude –space- Phase
Like this;
100 70 -60
101 70.1 -59
etc
Then I can put that into the computer and adjust the time part to see if there is a time which has less total phase shift.
However, making flat measured phase like band pass filter, like the SH-50 above is no easy task, multi way speakers can easily have non-minimum phase at crossover as there can be sources at two different acoustic distances and normal crossovers have “all pass” phase shift at 90 degrees per order at 2nd order and above (phase far above to far below the xover point). Also mid and high frequency drivers can have regions that are also non-minimum phase due to changing radiation resistance or changes in directivity.
Unlike the electronic world of R’s L’s and C’s, in acoustics one finds there are frequency dependent R’s that sometimes are part of reality. These effects can produce changes in amplitude with less than corresponding phase change one would expect from that change in amplitude.
Anyway maybe there are things, which would be more visible if there wasn’t what looks like some time delay left in the acoustic phase plot.
Rybaudio;
What I meant was that by isolating the phase part alone your not including the other things that go along with the spatial conditions that produced that phase shift.
While phase is equal to time, which is like physical depth or position in Z, a thought experiment is worth trying.
Lets pretend you have two two way speakers, one where the tweeter is within say 1 /4 wl from the lower driver at crossover and the other system the tweeter is say 4 wavelengths above the woofer at xover.
Now, from the mic position in front, the distances are the same, the amplitude and phase are the same.
The issue is that even if the amplitude and phase are identical at measurement position, what you hear in a room also includes the energy going in other directions.
The speaker with the larger spacing makes many lobes going every which way exciting more reverberant sound (bad for stereo), the close spaced one has one forward lobe.
Errors in X, Y and Z can be adjusted “on axis” with DSP etc, but only in one spot, fixing it at the source eliminates the problem.
If one had the luxury of doing it, one could take two identical multiway speakers and bi amp them with a modern speaker controller.
Then one can A-B right against left, one choice against the other, try different filter sets and delays to “hear” the difference on the exact speaker geometry in question, in a room.
This is actually pretty cool to do if you can and Xilica makes controllers that have FIR filters (no phase shift from the filter).
Sadly there is no analogue FIR filter but some systems allow the depth to be altered sufficiently.
Best,
Tom
omni said:however, much of it is Greek to me, but I am willing to learn to understand........
Bingo! I am Greek and I can help out!

Salas......Thank you very much.......So as for your help.....Can you tell me what the zig zags indicate and what I should be looking for?......Any help in interpreting these phase charts?....Omni
frequency is only half of the picture, phase is the other half. It describes "when" the frequency occurs in time.
As many have said, your original charts are muddied by the excess delay that shows up as this exponentially increasing phase shift with frequency (1ms delay is significantly more and more of a cycle as F increases)
Most people plot phase on a -pi to +pi scale with 0 phase shift in the center (a full cycle traverses 2*pi phase). When the phase falls below -pi, it suddenly re-appears at the top at +pi because -180 degrees is the same as +180 degrees. This is called "phase wrap"
When the delay is removed from your plot, then you will have a phase response which can be interpreted. But not before.
Omni,
To understand what is good phase response is, read the paper I linked to by John Kreskovsky.
Second, interpreting your graphs is harder with all the extra delay in there but not impossible. What makes it tough to say if they are good bad or otherwise is there isn't enough information in your posts or pictures to know what the phase should be.
To interpret phase in a frequency and response plot, you first need to know what the phase should look like if your design is correct. To do this we need to know the intended crossover point(s), and the acoustic slopes you are trying to accomplish.
For example, a two way 4th order Linkwitz Riley at 2500 Hz. This is called your target. For the drivers coupled with their XOs to sum properly the frequency response must match the target freq. response slopes, which I think you understand. But in addition to this, for the drivers to sum properly the phase response has to match the target phase as well. In the case of a 4th order LR XO, this means the drivers must be in phase (have the same phase) over as wide a range on either side of the XO point as possible.
In the case of a 4th order Linkwitz Riley, "perfect phase" would mean that at any frequency on the graph , the tweeter phase and woofer phase would be exactly the same on the phase plot. i.e the graph for the tweeter phase plot line would be exactly the same as the woofer.
Please note that this relationship between the woofer and tweeter phase depends on the target slopes (linkwitz 2nd order, Butterworth 1st order, Bessel etc) So this is why I said that it is hard to interpret your graphs because you don't really give us enough information to know how they should look.
That said, your high pass and bandpass phase seem to be in phase at about 3000 Hz but that is about it. So if your target XO says both drivers should be in phase, they don't match well except at that point.
One final thought, if you are trying to design a three way speaker,
they are difficult to get right with good measurements and a fair amount of experience. Without actual measurements and having limited experience in XO design, you have a tough road ahead of you.
Regards,
Dennis
salas said:
Bingo! I am Greek and I can help out!
omni said:Salas......Thank you very much.......So as for your help.....Can you tell me what the zig zags indicate and what I should be looking for?......Any help in interpreting these phase charts?....Omni
Iain and Dennis beat me into answering. Very thoughtful answers.😉
Dennis.......Thank you very much for you WELL thought out post and explanation...And Tom Danley.....I appreciate the time you have put towards my effort.......It is very late tonite, but I wanted to acknowledge your efforts......Sunday I will fill you guys in on my crossover intended slopes with a summed response chart and the particulars, so please keep an eye out.......Salas, your latest humble reply is greatly appreciated, however I have a feeling you have the knowledge to weigh in on this as well, so until tommorrow........live joyously..........Omni....By the way... I downloaded and printed the suggested paper by John K and am in the process of studying it...................
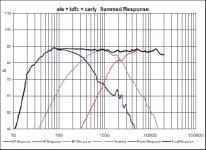
Gentlemen.......Attached is my latest summed response chart, which may require a little tweaking.....I am shooting for a tapered response across the chart, with a slight BBC dip.......Target alignment rolloffs I am shooting are Bessel........12dB/octave.......Target crossover frequencies are 350 Hz on the low end.....and 2500 Hz in the upper end.......Polarity for both midrange and tweeter is reversed.............Omni
Attachments
Hi Omni, my dear friend
Its been a long time , mate!
I am trying to be helpful, but your last graph looks much the same as 2 years ago? Kindly consider PLEASE, the logarithmic Y-axis which needs to be refined or 'homed-in-on' for proper evaluation.
Changing your vertical is, imho crucial to 'Frankie' sounding better!
Its logarithmic...its NOT a linear Y-axis. 40dB might sound like a mouse in slippers on carpet, BUT 110dB, which is your top scale, WILL sound like your ears being blown out next to a Boeing A340 on takeoff! This will make your graph look vastly different if squashed to normal listening levels of say, 70 to 90dB maybe. But, I think even 90dB is very loud? Like the headphone cones blowing?
It will then have Mt Everest size peaks! What I'm politely trying to say is that IF you stay with a 40 to 110dB volume axis on your graph, then my friend, you will NEVER EVER get a good sound.
<other folk please reply?>
Please sort out the response curve first, THEN tackle the phase issue. One thing at a time. Sort out the most important thing first.
You have invested heaps of time and money in Frankie, so maybe find a local Ohio enthusiast who has testing gear, microphone and Speaker Workshop? SW is great, you can change the axes, and the phase plots are meaningful. My project stopped, because, ..well, you know, I ran out of money from the SubPrime drama.
I hope my lack of knowledge and dumb but well meaning audacity has not offended anyone here? I just want my friend Omni to achieve the BEST POSSIBLE OUTCOME for 'Frankie' ASAP! He deserves it.
In my very un-learned opinion, 'one' must get the graphs right first and sort the wood from the trees, to get it right. As you know I have not been able to do that with passive crossovers in my 3-way. But a cheap Behringer solution IS possible, I am told, with some cheap Amps.
There's been lots of brilliant comments here, but I still firmly believe in Sretens comments regarding frequency, phase and minimum total Z (complex impedance, the real and imaginary Z components). Sreten makes sense. Best wishes, Grant , and Happy XMAS to all.
Omni, I have a new internet phone , so I can call you for peanuts!
0011 61 2 43 05 27 XX
If you're talking about the phase of a given completed system, then my answer is that it doesn't matter much. It is possible to screw up phase in such a way that it will be audible, but for anything reasonable you might do, the phase response of the end system isn't much of a concern.
I´ve been struggling with flat phase response related to transient perfect.
My crossover is active linear phase which has alingment delay so phase response can be as flat as speaker/driver can give.
But my system has horns and driving horn near lower frequency limit there seems to be big phase hump.
with horns less the delay to more "transient perfect" impulse response makes phase hump more and vice versa.
with sealed enclosures it was easier to achieve "transient perfectness" with flattish phase response
as what comes to sound, sealeds are like trousers and horns more the stayup stockings
- Status
- Not open for further replies.
- Home
- Loudspeakers
- Multi-Way
- Phase response inquiry