Martin,
The results I get from the alignment table give me a too big cabinet (67L, that's a little too much for a floorstander)
The external dimentions I'd like are (approx) 100*20*30 cm
so an internal volume of 40L
What's the safest way to reduce the volume?
PS: another thing I saw: for a given driver and S0/SL ratio, the box volume stays the same (+-2L) independently of the tuning frequency. Is this normal? I thought that low tuning frequencies required bigger volumes
Hi tda,
If the SPL response is smooth, and has the bass extension that you desire, then the design is probably a good set of compromises.
Hello Bricolo,
The first set of alignment tables produced designs that were in general bigger then are really required. People provided this feedback, along with other comments, and I used this input when formulating the second set of tables. So the table you present comparing the two different results is consistent with the intent of the newer alignment tables. In general, if you want more bass form a TL (holding L and S0/SL constant) you increase the cross-sectional area, you do reach a point of diminishing return at some point. So the newer alignment tables sacrificed a little bass for a smaller package. If you continue to reduce the size of the TL to meet your desired final dimansions you are trading off bass response. If you really want to reduce the size try a ML TL but that is a different configuration not covered by the alignment tables.
I try and include the date and my name on everything on the site. For the "pdf" article files it is at the top of each page in the header. For the worksheets it is on the first page. For the "html" code I try and include a date with the hyperlink. I am doing the best I can but I am not perfect. Anybody who is really interested in being up to date on all of the revisions and new stuff should consider my mailing list.
I don't understand your comment, could you help me out with a few more details.
What I mean with my question was if the SPL graph looks smooth, could be other graphs that indicates a problem with the enclosure?
If the SPL response is smooth, and has the bass extension that you desire, then the design is probably a good set of compromises.
Hello Bricolo,
The first set of alignment tables produced designs that were in general bigger then are really required. People provided this feedback, along with other comments, and I used this input when formulating the second set of tables. So the table you present comparing the two different results is consistent with the intent of the newer alignment tables. In general, if you want more bass form a TL (holding L and S0/SL constant) you increase the cross-sectional area, you do reach a point of diminishing return at some point. So the newer alignment tables sacrificed a little bass for a smaller package. If you continue to reduce the size of the TL to meet your desired final dimansions you are trading off bass response. If you really want to reduce the size try a ML TL but that is a different configuration not covered by the alignment tables.
Martin, maybe you should add the date of the files on your websites (some have a date (the focal project), but some haven't (the 8 TL theory files))
I try and include the date and my name on everything on the site. For the "pdf" article files it is at the top of each page in the header. For the worksheets it is on the first page. For the "html" code I try and include a date with the hyperlink. I am doing the best I can but I am not perfect. Anybody who is really interested in being up to date on all of the revisions and new stuff should consider my mailing list.
PS: another thing I saw: for a given driver and S0/SL ratio, the box volume stays the same (+-2L) independently of the tuning frequency. Is this normal? I thought that low tuning frequencies required bigger volumes
I don't understand your comment, could you help me out with a few more details.
MJK said:
I don't understand your comment, could you help me out with a few more details.
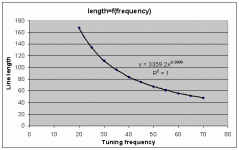
I added a line in my excell worksheet, that displays the box volume (simply Line length*((S0+SL)/2)*Sd) If my math is correct 😀
Then, when I keep the SL/S0 ratio the same, (and of course with the same loudspeaker), I calculate the TL parameters (according to the alignment tables) for the line tuned to different frequencies-> I always get the same volume for the cabinets
Exemple, with the same driver as in my picture before:
SL/S0=0.333
With a TL tuned to 20Hz-> cab volume is 68L
35Hz-> 68L
40Hz->68L
50Hz->68L
70Hz->68L
Do you see what I mean?
To explain it differently, when I change the tuning frequency without changing the SL/SO ratio, the cross sectional area change in order to keep the internal volume the same
Hi Bricolo,
I see what you mean and for the assumptions you have made the numeric result is correct. But lets look at what you have assumed, maybe without even realizing you were making the assumption, and see if is makes any physical sense.
Starting with the equation at the bottom of page four from my 10/16/03 alignment table article.
S0 = rho x c x (Sd^2) x Dz x DR x Re / (BL)^2
Using the same driver then Sd, Re, and BL remain constant. The quantity DR is a function of Qts so it remains a constant. The rho and c are constants. The term Dz is a function of SL/S0 and for a given SL/S0 it increases linearly with frequency. Also, for a given SL/S0 the length will decrease linearly with frequency. So without changing any of the driver parameters, the volume will be constant as you describe.
The alignment tables assume that the tuning frequency of the line is approximately equal to the driver's fs. So the alignment tables think that your driver properties are changing as frequency increases. If you now back out the remaining T/S properties (Qes, Vas, Mms, and SPL at 1 m for 1 w input) based on the ones fixed above and assuming different frequency values, I think that you will see some problems. What you have done makes numeric sense but does not make physical sense.
Hope that helps,
MJK said:Hi Bricolo,
I see what you mean and for the assumptions you have made the numeric result is correct. But lets look at what you have assumed, maybe without even realizing you were making the assumption, and see if is makes any physical sense.
Starting with the equation at the bottom of page four from my 10/16/03 alignment table article.
S0 = rho x c x (Sd^2) x Dz x DR x Re / (BL)^2
Using the same driver then Sd, Re, and BL remain constant. The quantity DR is a function of Qts so it remains a constant. The rho and c are constants. The term Dz is a function of SL/S0 and for a given SL/S0 it increases linearly with frequency. Also, for a given SL/S0 the length will decrease linearly with frequency. So without changing any of the driver parameters, the volume will be constant as you describe.
The alignment tables assume that the tuning frequency of the line is approximately equal to the driver's fs. So the alignment tables think that your driver properties are changing as frequency increases. If you now back out the remaining T/S properties (Qes, Vas, Mms, and SPL at 1 m for 1 w input) based on the ones fixed above and assuming different frequency values, I think that you will see some problems. What you have done makes numeric sense but does not make physical sense.
Hope that helps,
Hi Martin
Thank you for the explanations, now I understant why the volume is constant.
You're right about the numeric/physical sense. when I checked if the volume was independent of the tuning frequency, I only used your alignment table and my excell sheet but didn't play with mathcad.
I've tested your worksheet with a 20Hz and 70Hz alignment with the values I get, and now I see what you call physical nonsense
You told that the TL should be tuned approximately to the driver's Fs. What is a safe value for the approx? One octave higher/lower, a half octave, less, more? My driver's Fs is 40Hz, how low could I extend the bass while still staying in a safe alignment?
MJK said:
Also, for a given SL/S0 the length will decrease linearly with frequency.
I'm sorry but that's not the result I get.
For a given SL/S0, the length decreases with frequency, but with a 1/x rule
Hi Bricolo,
I think that if you round the driver fs to the nearest 5 Hz in the table that is about as far as I would stray without running a MathCad simulation to check the results. If you want to tune 10 or 20 Hz above or below the driver fs using the alignment tables, I think a MathCad simulation is required just to make sure things are still working right.
For example, if I look at the length alignment table and in particular the row for SL/S0 = 1, at 20 Hz the length is168 inches. If the frequency doubles to 40 Hz, the length decreases to 84 inches. The quantity DZ for these same frequencies is 19.4 and 38.8 respectively. This is what I ment by linear, maybe that was a bad choice of words.
You told that the TL should be tuned approximately to the driver's Fs. What is a safe value for the approx?
I think that if you round the driver fs to the nearest 5 Hz in the table that is about as far as I would stray without running a MathCad simulation to check the results. If you want to tune 10 or 20 Hz above or below the driver fs using the alignment tables, I think a MathCad simulation is required just to make sure things are still working right.
I'm sorry but that's not the result I get. For a given SL/S0, the length decreases with frequency, but with a 1/x rule
For example, if I look at the length alignment table and in particular the row for SL/S0 = 1, at 20 Hz the length is168 inches. If the frequency doubles to 40 Hz, the length decreases to 84 inches. The quantity DZ for these same frequencies is 19.4 and 38.8 respectively. This is what I ment by linear, maybe that was a bad choice of words.
For a straight pipe :
L = 2 phi x c / (4 x f)
which after simplifying
L = 3366 / f
Your result checks.
L = 2 phi x c / (4 x f)
which after simplifying
L = 3366 / f
Your result checks.
Hi MJK,
Before I wrote this thread and Tl Basic Design Question.
thread, I knew very little about TL design. I tried to understand what Bob wrote, but it confused me because he made it so detail!
Based from yours and other guys answer in both threads, I reread Bob' TL site and now it's very easy and clearly to understand what to achieve and what to avoid in designing TL speaker.
BTW, is it true by extending TL resonant freq. below fs will change the sound from the original (colorization?) or it just boost the lower part of FR to flatten it?
see you.
Chris
Hi Chris,
In general, I doubt tuning below fs will flatten out the TL SPL response. You should model any geometry you are considering, in MathCad, and see what the predicted response looks like. Depending on the driver's T/S properties, I have found that tuning to fs works very well. This was the basis behind my alignment tables.
But having a MathCad model to try out potential designs allows you to be creative quickly and without spending any money. Then pick the design that appears to be the best. I usually have two or three designs worked out in MathCad to compare the different graphs before selecting the one I build. If there is a tie, I build the simpler design.
BTW, is it true by extending TL resonant freq. below fs will change the sound from the original (colorization?) or it just boost the lower part of FR to flatten it?
In general, I doubt tuning below fs will flatten out the TL SPL response. You should model any geometry you are considering, in MathCad, and see what the predicted response looks like. Depending on the driver's T/S properties, I have found that tuning to fs works very well. This was the basis behind my alignment tables.
But having a MathCad model to try out potential designs allows you to be creative quickly and without spending any money. Then pick the design that appears to be the best. I usually have two or three designs worked out in MathCad to compare the different graphs before selecting the one I build. If there is a tie, I build the simpler design.
Group delay
Hi,
When we design ported enclosure one of the important thing is: Group Delay, even with T/S optimum design, it gets around 4 times longer than closed box and it gets more longer when we tune the box lower than Fs.
How about TL design? is it shorter same or longer than ported enclosure?
How can we calculate it for TL design?
Is there any graph to show it in MJK mathcad?
Chris.
impedance graph
Hi MJK,
I have a question regarding impedance plot, there are 2 opposite achievement to make it right for TL, if I understood it correctly:
1. Your answer in this thread dated 01-07-2004:
(MJK) Watch the graphs as you move the woofer along the line and add or increase stuffing at different locations. The goal is to have a strong first peak in the terminus to augment the driver's rolling off bass bass, then damp out the other peaks to reduce ripples.
2.From Mini Mite ESL project by Sheldon D. Stokes, .Jordan TL Bass :
The line should be stuffed just until the lower peak disappears, and the upper peak becomes a smooth single peak.
You mentioned the second peak should be damped, Sheldon damped the first one (attached graph below), so I get confuse.
Would you mind explaining what the good/bad things happen for both answer?
regards,
Chris
Attachments
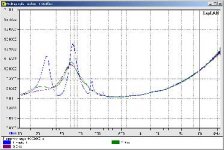
Hi Chris,
The second peak I was refering to is in the terminus SPL response. You want the first peak to add bass but not the second which produces a ripple in the system SPL response.
I do not add stuffing until the first impedance peak is smoothed, this is an old rule of thumb that people typically apply to TL designs as a sign of correct damping material amounts. I don't believe this is correct and usually end up with two peaks in the impedance curve like a bass reflex design.
A small question regarding the woofer displacement plot:
I assume the graph is for a 1 W. What is happening when you put 10 W? At 1 W, at 45 HZ the woofer displacement is almost equal with XMAS of my driver...this means that at 10 W the most lower frequency will be something around 90 Hz?
I assume the graph is for a 1 W. What is happening when you put 10 W? At 1 W, at 45 HZ the woofer displacement is almost equal with XMAS of my driver...this means that at 10 W the most lower frequency will be something around 90 Hz?
tda said:A small question regarding the woofer displacement plot:
I assume the graph is for a 1 W. What is happening when you put 10 W? At 1 W, at 45 HZ the woofer displacement is almost equal with XMAS of my driver...this means that at 10 W the most lower frequency will be something around 90 Hz?
I was also wondering
Hi tda,
Do you plan on listening to your speaker at a single frequency and 10 watts of input? I never do this, I listen to music.
This is one of the reasons I don't like looking too closely at the displacement curve. When you are listening to music you are hearing a broad band of frequencies whose sine waves add and cancel as a function of time. If you are really putting in 10 continuous watts, you must like really loud music, only a portion of that will be in the low frequencies where displacement is a concern. You can even get into a situation where you are putting in enough power to exceed Xmax at a particular frequency if it acted alone but when combining with all of the other frequencies not actually exceed Xmax. For example look at the terms in a Fourier series that make up a square wave, the magnitude of the fundamental is larger then the magnitude of the square wave. For most normal acoustic music, I don't see Xmax being a huge issue.
I assume the graph is for a 1 W. What is happening when you put 10 W? At 1 W, at 45 HZ the woofer displacement is almost equal with XMAS of my driver...this means that at 10 W the most lower frequency will be something around 90 Hz?
Do you plan on listening to your speaker at a single frequency and 10 watts of input? I never do this, I listen to music.
This is one of the reasons I don't like looking too closely at the displacement curve. When you are listening to music you are hearing a broad band of frequencies whose sine waves add and cancel as a function of time. If you are really putting in 10 continuous watts, you must like really loud music, only a portion of that will be in the low frequencies where displacement is a concern. You can even get into a situation where you are putting in enough power to exceed Xmax at a particular frequency if it acted alone but when combining with all of the other frequencies not actually exceed Xmax. For example look at the terms in a Fourier series that make up a square wave, the magnitude of the fundamental is larger then the magnitude of the square wave. For most normal acoustic music, I don't see Xmax being a huge issue.
- Status
- Not open for further replies.
- Home
- Loudspeakers
- Multi-Way
- Perfect TL with MJK mathcad graph?