This looks awesome and "correct" 😎 some questions:...
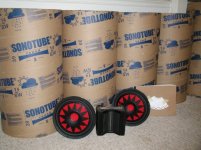
- is that 10" or 8" woofer?
- How did you bend the metal poles ? 🙂
As for finding out pipe resonance, normally I just lift the speakers a bit and poke the microphone. I'ts very revealing.
Hi A,
no offense meant. I ran into the issue myself with the midwoofer and no damping could fix it.
Just put a mic very close to the membranes and measure the frequency response with periodic noise at loud enough levels. Then you might see the fundamental resonance and some of its multiples that are re-radiated through the membranes easily.
What subs are you using and where are the x-over points ?
BTW, I like the look !
Oliver
Ha! you never told me that. But this is exactly one 'issue' I could not fix with my Pluto clone!
I measured the pipe resonance via impedance and FR and could see them 210hz...420hz... etc. from memory. Tried this and that with damping but in the end they were still 'audible'. I even tried notching *every* peak at one stage 😀
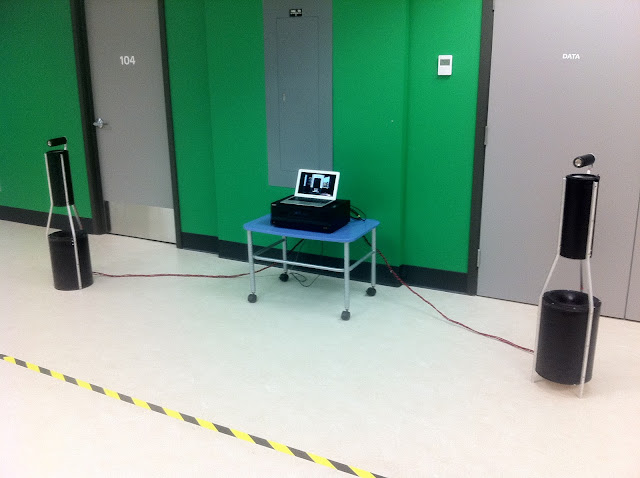
Here is my effort at omni speakers.
I enjoy them very much but wish I had some measurement equipment to show me changes in x'overs etc. Perhaps Santa will be nice to me this year..... 😀
As it is I use a single cap of 6.8 ufd to crossover 1st order around 7 kHz - and that's it.
There is more info over at this old thread - but it is a very long thread: http://www.diyaudio.com/forums/multi-way/100390-ohm-acoustics-walsh-f-speaker-remakes-6.html
Attachments

Last edited:
This looks awesome and "correct" 😎 some questions:...
- is that 10" or 8" woofer?
- How did you bend the metal poles ? 🙂
As for finding out pipe resonance, normally I just lift the speakers a bit and poke the microphone. I'ts very revealing.
It's a 10". Same Peerless unit as the Pluto sub. Poles were bent in a special way 😎. Meaning I had a shop do it.
Poke the mic? What's that?
No tweeter?
Fullrange? pointing at ceiling.
Treble is more directional from a fullrange than from the small radiating area of the diaphragm of a tweeter, if you did not add a forward radiating tweeter or flooder device what would you expect?
the treble would be more open and airy with more direct treble.
Very large, hardly a point source.
No wonder a dipole worked better.
The fullranger was a Ciare HX201 with massive treble rise, so that direct sound plus treble reflection gave a fairly good frequency response.
I hate dipole airiness, so I prefered it in a closed or almost closed setup.
Against all odds it works well => Interim Conclusionshow is the listening experience with such directivity
Only for bass. Not in a range where wavelength compared to the size of the driver basket becomes significant.Hey, I like the upside down driver. That seems like a good idea.
Even Pluto has it. It is just a matter of audibility. Maybe here the alu membrane has a slight advantage over less rigid materials. But at this stage the statement is speculative.Ha! you never told me that. But this is exactly one 'issue' I could not fix with my Pluto clone!
how is the listening experience with such directivity
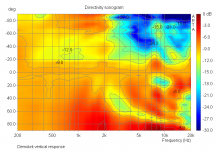
The graph is highly misleading because just a single measurement was used to generate the sonogram. You can use any single measurement to generate such a graph. It even doesn't need to be flat if normalization is used.
For such a concept it would be more interesting to see a vertical sonogram. Unsmoothed, free field, mic at about 2m distance and not at 1m.
Last edited:
The graph is highly misleading because just a single measurement was used to generate the sonogram.
errr... I think you underestimated the design prowess of Herr 2Pi 😀
He was the one who taught me sonograms. Many sonograms was produced thereafter. 😎
errr... I think you underestimated the design prowess of Herr 2Pi 😀
He was the one who taught me sonograms. Many sonograms was produced thereafter. 😎
So what's wrong with what I've said?
That the graph is misleading ? 🙂
Yes, because
a) the infinite number of horizontal points is replaced with just a single data point (measurements should prove or disprove a hypothesis, here it's just an illustration of the hypothesis)
b) normalization masks any resonance
c) the mic is too close, i.e. not in the far field
c) With such a small driver the mic is in the far field at 1m distance
a) I verified that the response did not change horizontally. So it does not matter if I use 1, 2, 3 or much more measurements. The time that was saved to take snap shots every 5° or 10° or whatever degrees is spent well elsewhere.
b) agreed on normalization. That's why I also show other diagrams and mention that it is normalized.
Compare the vertical measurements. There I went the full 9 yards because the response does change.
c) With such a small driver the mic is in the far field at 1m distance
Yes? There's a diffraction device involved. Did you confirm with measurements?
a) I verified that the response did not change horizontally. So it does not matter if I use 1, 2, 3 or much more measurements. The time that was saved to take snap shots every 5° or 10° or whatever degrees is spent well elsewhere.
How did you verify if not by measurements??
b) agreed on normalization. That's why I also show other diagrams and mention that it is normalized.
Compare the vertical measurements. There I went the full 9 yards because the response does change.
Could you also posts a sonogram with vertical data?
Yes, if I remember correctly I went up to 1.7m.Yes? There's a diffraction device involved. Did you confirm with measurements?
I did measure it ! I probed one side with one of the little poles. Then I compared the graphs by substracting them from each other. The result was a flat line. Only the calculation/the picture is based on one measurement because it would have made no difference.How did you verify if not by measurements??
I have no reason to cheat here. I am not afraid of the work. One intention of the horizontal sonogram was and is to show that nice pictures cannot describe how a speaker really sounds regardless of how perfect they are.
If you can read that better than the polar plots I can do that (next week).Could you also posts a sonogram with vertical data?
Thanks for the additional information.
Well, one can read that graph one way or the other. I obviously chose the wrong one 🙂
Would be nice.
One intention of the horizontal sonogram was and is to show that nice pictures cannot describe how a speaker really sounds regardless of how perfect they are.
Well, one can read that graph one way or the other. I obviously chose the wrong one 🙂
If you can read that better than the polar plots I can do that (next week).
Would be nice.
There you go. Again, 0° is on listening axis. + is up and - down.Would be nice.
This is normalized. The exact same data that is published on my site as polar plots.
Attachments
- Status
- Not open for further replies.
- Home
- Loudspeakers
- Multi-Way
- OMNI Gallery