Don't get me wrong a lot of what I work on with sound involves me programming different scenarios and then setting up a switch to be controlled with a midi controller at the listening location. I use A/Bing for sure. I think every mixer should use it as well when making adjustments similar to the way someone color correcting would jump back and forth between his adjustments to see exactly what is happening to the signal. BUT I have set up situations where the signals being fed into the room differ measurably vastly and giving myself a few seconds for the sounds to perceptually shift into place and given that they are level matched the perceived results are in every conceivable way is the same. These are situations where if you were sticking mics I am pretty sure the sounds that get picked up would differ drastically but somehow you perception just sorts all of this out and there really is no effective difference.
Without knowing the details of what you're trying to do I really can't comment any further but it looks like your methodology here is flawed. You're changing too many parameters at once to get meaningful results.
I have just found this to not be true. The binaural head will not reject late arrival times but your brain will. Now playback the binaural recording and the late reflections are hard coded onto the recording and you simply can't ignore them where in the real room you would.
You're still misinterpreting my comments. I'm not talking about binaural recordings as a technique for recording music but as an assessment tool for evaluating recording/loudspeaker/room performance.
By the way, the HRTFs you're getting with a dummy head are not accurate enough. You need to use your own ears.
I misunderstood. Then the issue is purely one of near field and direct/reverb ratio. When sitting too close you are too much in the near field and the response of the direct field is not smooth and the direct/reverb ratio is higher. As you move back, the near field issue resolve and the direct/reverb ratio goes down. Clearly with a Summa the reverb field is the smoother response that the direct near field.
Then the Summa's far field starts farther than 2 m because Patrick never listened closer than that.
You're still misinterpreting my comments. I'm not talking about binaural recordings as a technique for recording music but as an assessment tool for evaluating recording/loudspeaker/room performance.
By the way, the HRTFs you're getting with a dummy head are not accurate enough. You need to use your own ears.
Well I have tried it with my own ears but I can always give it another try. Still I get exactly what you are saying. I just don't agree. I think you don't get what I am saying. From Earl's white paper
"As the directivity gets narrower and narrower however, it should be intuitively obvious that I can orient
the speaker in such a way as to avoid the nearer boundaries and thus minimize the VER to a much greater degree. In
fact, it can be shown that the higher the directivity, the greater the average Reflection Free Time (RFT) immediately following
the direct sound. Ideally this would be about 20 ms, but that is never going to happen in a small room. Even 10 ms
requires some significant room modifications to achieve in typical sized listening rooms. However, it is quite true that the
more that can be done to extend this RFT the better the image will be, with diminishing returns beyond about 10 ms."
With this in play I think you basically are adding another room to the recording by re-amping the way you are talking about. But in a normal listening situation this room is largely ignored - well if you use the "right" speakers.
Hi,
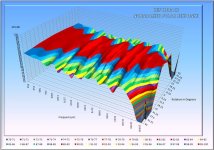
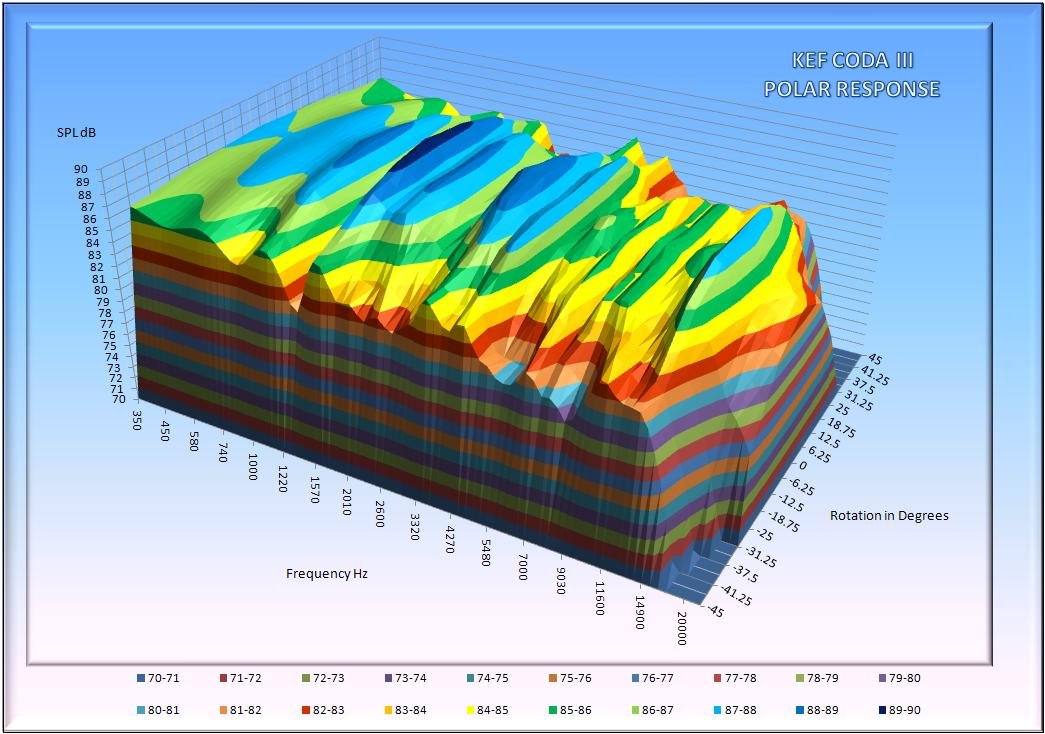
Inspired by Earl's graphics I decided to see if those of us who don't have access to expensive softare could format up data in excel to present polar responses in a more meaningful way.
Below are my current graphs. I will not pretend it is easy to creat these but it is possible.
So what does the graph tell us, well probably that the CODA III was not KEF's finest hour;
Regards,
Andrew
This is great, I'd love to see a standard format and if it is Excel all the better. BUt it does need to be setup as a standrd excel file so that all I need to do is import the data and the plots appear. Otherwise it won;t be viable. Can you just post an excel file that does this and we can import our own data?
Honestly, I think that the data that you are showing is rather typical. It shows how much more of the problem are apparent in this kind of data presentation. The myruad of resonances that affect the axial as well as the off-axis response will created a colored sound as both the direct field and the everbe field will display the same peaks and dips.
Last edited:
Well I have tried it with my own ears but I can always give it another try. Still I get exactly what you are saying. I just don't agree. I think you don't get what I am saying. From Earl's white paper
"As the directivity gets narrower and narrower however, it should be intuitively obvious that I can orient
the speaker in such a way as to avoid the nearer boundaries and thus minimize the VER to a much greater degree. In
fact, it can be shown that the higher the directivity, the greater the average Reflection Free Time (RFT) immediately following
the direct sound. Ideally this would be about 20 ms, but that is never going to happen in a small room. Even 10 ms
requires some significant room modifications to achieve in typical sized listening rooms. However, it is quite true that the
more that can be done to extend this RFT the better the image will be, with diminishing returns beyond about 10 ms."
With this in play I think you basically are adding another room to the recording by re-amping the way you are talking about. But in a normal listening situation this room is largely ignored - well if you use the "right" speakers.
Here we go. Earl's statement about 20ms (or Linkwitz's 6ms) is not a scientifically proven fact. It's just a practice in control room design that has evolved over time. If someone wants to start a discussion about this topic he should be quite familiar with the references Toole lists in his book. I've already been through this discussion and in the end (if anybody survived the flames) the simple finding is that we don't have enough data - qualitatively and quantitatively.
Listening to a binaural recording of two speakers in a room or listening to the actual speakers in the room will produce the same perception. It's crucial to listen through your own ears (instead of using a dummy head) and to correct the transfer function of the headphones (and associated electronics). This is exactly what the Smyth Realiser does.
Can you just post an excel file that does this and we can import our own data?
I would very much appreciate it.
The myruad of resonances that affect the axial as well as the off-axis response will created a colored sound as both the direct field and the everbe field will display the same peaks and dips.
I find it rather hard to qualify the detrimental effect on the indirect sound field. Flat, ok, but how flat? Angle and delay of reflections is significant too.
Hi Earl,
I think I can creat a file in which if you copy your data into the correct cells the graph will appear. However to do this the data needs to be in a consistant format.
The current sheet is a mess as it took me a while to work out how to get this to work. However if we come up with a data interface standard I can rework it to make something more universal.
Here is my proposed standard please comment if you think it should be different.
17 data sets for the polar responses at:-
-45 -41.25 -37.5 -31.25 -25 -18.75 -12.5 -6.25 0 6.25 12.5 18.75 25 31.25 37.5 41.25 45
Each data set to contain 200 points (Arbitary decision).
My current data set is 84 points but it is a bit rough so this is a compromise between time to manipulate the data and smoothness. If there is a standard data set size I am happy to change to it. (It cannot be changed on the fly as it will mess up the axis labels)
Data to be in SPL. (70dB to 100dB)
I will set the range between 100dB and 70dB. It is fairly easy to re-size this range but the colours change and it is tedious to set them back to something that looks good. If the range can be smaller than this it would be better but I am thinking that with the range of efficiencies in speakers it will be required if we want all graphs on the same scale.
My current sheet takes relative data from Holm Acoustics and offsets it to creat the correct SPL level, however I suspect alot of people will have SPL data and you can get Holm Acoustics to do this before you export the data, I just forgot.
Frequceny steps: 200Hz to 20,000Hz in 200 log spaced readings
Frequency steps must be logarithmic as Excel will not convert to a logarithmic scale.
What do you think?
Is this a format that enough people will be able to create to make it worth while?
I have attached the normailsed data on a 70dB to 100dB scale to give an idea of what this would look like. Once the data is entered excel can easily creat the normalised and un normalised data and the contoured or flat views so all the graphs can be dispalyed. Note that the flat view is not completely flat it is the contoured data from almost directly above.
Regards,
Andrew
Attachments
Last edited:
My 2 cents
I would like to see 5° or 7.5° increments, ±90°.
Should be based on the actual data input. Earl?
Range of 60dB
Log display for frequency is fine.
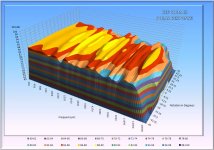
I find find the "block" 3D view more unambiguous:
17 data sets for the polar responses at:-
-45 -41.25 -37.5 -31.25 -25 -18.75 -12.5 -6.25 0 6.25 12.5 18.75 25 31.25 37.5 41.25 45
I would like to see 5° or 7.5° increments, ±90°.
Each data set to contain 200 points (Arbitary decision).
Should be based on the actual data input. Earl?
Data to be in SPL. (70dB to 100dB)
Range of 60dB
Frequency steps must be logarithmic as Excel will not convert to a logarithmic scale.
Log display for frequency is fine.
I find find the "block" 3D view more unambiguous:
I have found a way I think I can iterpolate the data from an arbitary data set size to always have 200 data points on the correct scale. Data input can then be linear or logarithmic. If you use linear data you will need alot or interpretation at the bottom end will be rubbish. Interpolation or fixed data set size will be required or the graph will need fetling each time you enter new data. The interpolation is linear no fancy cubic options I am afraid.
I can set up both 5 degree and 7.5 degree options eventualy but lets choose one or the other at the moment as this is now looking like it is going to take a long time to set up.
Excel is not very adaptable when using 3D graphs so the data input will all be required. 90 to 90 in 7.5 degrees is 24 data sets. Are you really all up for this much measurement? Every data set will have to be manually copied into the correct place in the table. I am not an excel genius like the guys at FRD so no fancy input screens.
I do not have a data set like this so if I am to creat this spread sheet someone will need to send me one as I don't feel the CODA merits that much measurement and my measurement system is not set up at the moment. I guess I could coble something together by duplicating data from teh CODA data set but it would be better to work with real data.
Range change is trivial but I don't think you will be able to read the legend with this large a range and the option is all range points displayed or none. (This seems to be a function of the way the contour system works as other graphs alow sparse points) I have changed the range to 60dB to 100dB but note to make this readable I have had to go to 2dB steps which means the colour bands are 2dB wide. (shown below)
If there is someone who is expert with excel out there and laughing at my poor graphing and data manipulation skills please feel free to step in. It took all of today to work out the graphs here, so I suspect it will take a very long time for me to work out a generalised solution. However I will have a go if people are interested.
Regards,
Andrew
Attachments
Here we go. Earl's statement about 20ms (or Linkwitz's 6ms) is not a scientifically proven fact. It's just a practice in control room design that has evolved over time. If someone wants to start a discussion about this topic he should be quite familiar with the references Toole lists in his book. I've already been through this discussion and in the end (if anybody survived the flames) the simple finding is that we don't have enough data - qualitatively and quantitatively.
I don't need enough data for a standard. I am just trying to get across a basic point. Mics don't sound the same as the way we hear. That's it. There is a basic missing component in a recording chain that is there with your ears and brain - error correction.
Key, all we need to do is to recreate the soundfield at the entrance of the ear canal. This is something stereo or multichannel will never be capable of. Only binaural recording or wave field synthesis can do that.
Don't know what kind of "error correction" you're talking about. Please define "the error": Where and why does it occur? How can it be quantified and qualified?
Don't know what kind of "error correction" you're talking about. Please define "the error": Where and why does it occur? How can it be quantified and qualified?
By the way, this text by Helmut Wittek might be of interest for you:
http://www.hauptmikrofon.de/HW/Wittek_thesis_201207.pdf
http://www.hauptmikrofon.de/HW/Wittek_thesis_201207.pdf
Don't know what kind of "error correction" you're talking about. Please define "the error": Where and why does it occur? How can it be quantified and qualified?
Well I'm mainly talking about errors in a natural acoustic environment that may need to be offset in order to achieve intelligibility. This could be reflections in a reflection prone environment etc.. But it's not limited to that. A simple way that they have empirically proved there is such a thing in a lab is by taking a subject and using a calibrated device which pokes you in the toe and in the nose at the exact same time. Now there should be a measurable latency for the electrical signal generated in your toe to reach your brain compared to the time it takes from your nose to your brain. If your perception was totally passive then you should perceive the pin prick as hitting your nose slightly before it hits your toe because of this electrical latency. But people don't perceive it this way they know that they got poked at the exact same time. This is proof that your brain is performing error correction at least on a small level and I'm pretty sure you could apply it to sound and touch and prove the same thing - that there is a small latency in our perception in order for your brain to do some corrections that may be needed.
This is basic but I think it is a start.
http://upload.wikimedia.org/wikiped...stic_Model.jpg/800px-Psychoacoustic_Model.jpg
Will check the paper out.
Last edited:
There are a lot of effects we can observe. Psychoacoustics knows things like backward masking: a sound is masked by a subsequent sound. The small time delays we use to localize sounds suggest that our brain uses massive parallel processing. We observe all of this but we still don't understand enough to make use out of it for such a simple thing like sound reproduction. It might be not that simple after all.
Well yeah I don't think it is as simple as Linkwitz and others have made it out to be. But to me the complexity might imply that reproduction isn't nearly as hard as we think it is - because we can in fact handle very hostile acoustic environments with very little problem. I think we can be lead astray by measurements and expectation bias and a target of "perfection" without considering that sometimes perfect involves imperfections.
Hi Earl,
I think I can creat a file in which if you copy your data into the correct cells the graph will appear. However to do this the data needs to be in a consistant format.
17 data sets for the polar responses at:-
-45 -41.25 -37.5 -31.25 -25 -18.75 -12.5 -6.25 0 6.25 12.5 18.75 25 31.25 37.5 41.25 45
Each data set to contain 200 points (Arbitary decision).
Data to be in SPL. (70dB to 100dB)
Frequceny steps: 200Hz to 20,000Hz in 200 log spaced readings
What do you think?
Is this a format that enough people will be able to create to make it worth while?
Regards,
Andrew
Andrew Thanks for this.
First 45 degree is certainly not wide enough, it has to be at least 90. And 7.5 degrees is the largest angular span that I have found to be acceptable. As Markus said 5 degrees would be better, but 10 degrees is not quite enough. I tried a lot of angular resolutions and liked 7.5 the best, followed by 10. 5 is just too many points and doesn't show anything new.
In many cases, like all my speakers, I only need data on one side since the speaker is symmetric. But vertical responses do require both sides, but I don't do those very often. The format should, however, be capable of it.
Every data set will have to be manually copied into the correct place in the table.
If the data has to be entred by hand then it will never work. In my probgram I just have a file of data - a matrix of data in angles by frequency, my plots can handle any size of these - I just show the grid location to input to and read the file, the program then fills in the data. With 26 by 200 data points it has to be this way or I'm not going to use it.
Holmimpulse, which I use and I straongly recommend, will output the entire data set as a single file. Dealing with different data sets for each angle is a real pain. Take it from me.
As to scaling, I really don't like absolute numbers since these require a calibrated system and that is simply a pain in the ****. Just do +10 to -40 and have the data scaled to that. I usually set the 0 dB line to the mean of the axial response. This doesn't require a calibration to absolute number, which don't mean anything anyways. Of course its always possible to scale any data set to absolute numbers I just don't see the point.
I don't see why you can't just read in the frequencies as a vector and use whatever spacing and number are present. Thats what I do.
It sounds like getting the data into Excel is the hard part - and that being easy is critical. After that its not too hard, but I'm not an Excel expert, and I already have something that works fine.
I'm considering just writting a VB program that will do it because thats not too hard either and would be much more flexible.
I'm considering just writting a VB program that will do it because thats not too hard either and would be much more flexible.
I'm considering just writting a VB program that will do it
Would be appreciated!
- Status
- Not open for further replies.
- Home
- More Vendors...
- GedLee
- New White Paper posting