Hi all,
the QA403 is now available in Europe at ELEKTOR.
https://www.elektor.de/quantasylum-qa403-24-bit-audio-analyzer
Alfred
the QA403 is now available in Europe at ELEKTOR.
https://www.elektor.de/quantasylum-qa403-24-bit-audio-analyzer
Alfred
there is also a review of it:
https://www.elektormagazine.com/news/quantasylum-qa403-audio-analyzer-review
https://www.elektormagazine.com/news/quantasylum-qa403-audio-analyzer-review
Is it absolutely necessary to use 8ohm external loads?
I have two 4ohm 300W loads.
Is there a place to set the impedance?
I have two 4ohm 300W loads.
Is there a place to set the impedance?
not really available at Electorthere is also a review of it:
https://www.elektormagazine.com/news/quantasylum-qa403-audio-analyzer-review

I had to wait a few weeks for mine - I think they are close to matching demand. First few days using it haven't done very much as I forgot to order enough BNC cables/adaptors etc, but I have definitively characterized my WM8524G based audio oscillator (yes it pretty much matches the datasheet performance - something I had no way to be sure before).
And fun plot, resistor/X7R-cap divider distortion:

So 8V rms gives 0.5% distortion with an X7R capacitor involved! I also tried a regular log-taper carbon-track potentiometer and that showed no obvious signs of distortion which is interesting. Though I think that might have been at a lower signal level.
And fun plot, resistor/X7R-cap divider distortion:
So 8V rms gives 0.5% distortion with an X7R capacitor involved! I also tried a regular log-taper carbon-track potentiometer and that showed no obvious signs of distortion which is interesting. Though I think that might have been at a lower signal level.
X7R's may even be microphonic. Try connectiong it across the input and watch the spectrum while exciting it with an acoustic tone. A novel way to add space to a system?
Pot distortion is lower, in some cases much lower. I had to resort to two Radiometer CLT-1's to test pots. (One for the source and the other for the output). A decent pot- Alps, bourns, etc will get to -160dB. An Alpha can be challenged to get much below 120dB.
Pot distortion is lower, in some cases much lower. I had to resort to two Radiometer CLT-1's to test pots. (One for the source and the other for the output). A decent pot- Alps, bourns, etc will get to -160dB. An Alpha can be challenged to get much below 120dB.
Yes X7R are microphonic - simple demonstration is provided by most oscilloscopes - turn up to most sensitive setting and tap the BNC socket lightly with a pen/pencil - the wobble on the trace is due to this mechanically coupling to the PCB and the first component pretty much after the BNC socket is the ceramic AC-coupling cap...
IMD (SMPTE) measurement is IMHO wrongly implemented in QA403 and former QA40x !
I was baffled to find that the QuantAsylum QA403 reports at least 15 dB too good (=false) results on IMD (SMPTE) (60 Hz : 7 kHz, 4:1). QA's data did not correspond to validated IMD measurements with my other equipment.
I found that IMD isn't correctly implemented in QA403 (and also earlier QA40x) measurement software.
Here is why, see "QA40x and IMD Measurements" (https://quantasylum.com/blogs/news/qa40x-and-imd-measurements)
Quote:
"In computing the IMD products, we’re interested in comparing the modulation products relative to the carrier, or 7 KHz tone" And then: "...we can see a single modulation product is 94.7 dB below the 7 kHz, which means 106.7 dB below the carrier." Followed by: "the 2nd order harmonics are 103.7 dB below the 60 Hz carrier, and thus the SMPTE IMD figure would be –103.7 dB or 10^(-103.7/20) * 100 = 0.000653%"
At this point it gets messed up already.
The modulation products must be related to the 7 kHz signal and NOT to the 60 Hz signal (which is 12 dB (= 4 times) stronger than the 7 kHz signal). In the first sentence of QuantAsylum's description it appears that QA refers to the 7 kHz tone as the "carrier" which it isn't. Instead, the 60 Hz tone is the carrier. Nevertheless, the summed up amplitudes of the intermodulation products at both sides of the 7 kHz frequency (depending on the IMD-order chosen) must be related to the amplitude of the 7 kHz tone and the ratio expressed as db.
However, what QA does (latest QA403 software (v. 1.193); it relates the amplitude of the intermodulation products to the amplitude of the 60 Hz tone! This results in 12 dB too good IMD (SMPTE) readings.
Even worse, the summing-up of the individual intermodulation signals is also wrong as QA writes: "There’s another (added: intermodulation signal) on the other side at the same level. These two would sum and increase the overall level by 3 dB of this particular pair."
That's also wrong. Adding a signal amplitude (voltage) of a second signal that is at the other side of the 7 kHz signal (both are + and - intermodulation products of equal amplitude) increases the amplitude level by +6 dB (= double) on the decibel scale, not 3 dB (doubling a power level makes + 3 dB; but doubling an amplitude or voltage level makes + 6 dB)! Hence (for 2nd order IMD) the QA result is too good by +15 dB. And if 3rd and higher order IMD would be taken, the error increases further, because QA's math on summing up amplitude levels got wrong.
In QA's example (see link above), QA arrives at an IMD (SMPTE) of -103,7 dB.
Actually for QA's example it is -94,7+6 dB for only the first pair of IM-components (2nd order), thus -88,7 dB IMD (SMPTE) instead of QA's result of -103,7 dB.
Consequently, the plots from the automatic IMD (SMPTE) measurements generated from the QA40x are wrong.
For a description, how SMPTE IMD is measured correctly, see the manual from AP (Audio Preciscion) https://www.ap.com/technical-library/more-about-imd/:
Quote:
"SMPTE (DIN)
SMPTE IMD is a technique for measuring IMD (intermodulation distortion) according to the SMPTE RP120-1983 standard. The DIN intermodulation distortion technique uses a similar method.
The stimulus is a strong low-frequency interfering signal (f1) combined with a weaker high frequency signal of interest (f2). f1 is usually 60 Hz and f2 is usually 7 kHz, at a ratio of f1_f2=4:1. The stimulus signal is the sum of the two sine waves. In a distorting DUT, this stimulus results in an AM (amplitude modulated) waveform, with f2 as the “carrier” and f1 as the modulation.
In analysis, f1 is removed, and the residual is bandpass filtered and then demodulated to reveal the AM modulation products. The rms level of the modulation products is measured and expressed as a ratio to the rms level of f2. The SMPTE IMD measurement includes noise within the passband, and is insensitive to FM (frequency modulation) distortion."
I would like to see a software update which corrects both major flaws, the wrong reference tone (not 60 Hz but 7 kHz) an the wrong amplitude (= voltage) summing-up on the dB scale (doubling = +6 dB, not +3 dB).
Regards
Reinhard
Last edited:
Different tones sum by power because they are uncorrelated, only two signals of the same frequency add coherently. This is like light and laser light. 1mW red + 1mW green = 2mW. But laser-amplifying the red light to twice the amplitude gives 4mW.
When you have the mixing (=intermodulation) f0 +/- f1, then f0+f1 and f0-f1 are both uncorrelated signals although their origin is the same for both? Not easy to understand.
Nevertheless, IMD is calculated as the square root of the ratio of modulation power, I just saw. That means, +3 dB for taking into account the "other" symmetrical mixing product is correct.
Nevertheless, the frequency to which the mixing products get related by QA's software (i. e. 60 Hz) is the wrong one. Must be 7 kHz.
Last edited:
This is why Fourier analysis works, two tones of different frequency are orthogonal, same frequency are not.
Its easy to see this must be true if you think of two radio signals or two light signals, energy is conserved. Two different electrical frequencies can be losslessly combined using LC network for instance (think the inverse of a crossover). To sum two identical signals involves putting extra energy in, like a laser doubles a photon using an excited state of an atom/molecule.
Its easy to see this must be true if you think of two radio signals or two light signals, energy is conserved. Two different electrical frequencies can be losslessly combined using LC network for instance (think the inverse of a crossover). To sum two identical signals involves putting extra energy in, like a laser doubles a photon using an excited state of an atom/molecule.
As just said, I learned that its uncorrelated (like noise from different sources) and corrected myself. Or with other words: geometrical (orthogonal or rms-) summing.
I alerted QA re. the wrong reference frequency the software is using and the resulting 12 dB too good IMD-SMPTE in the QA403 automated IMD-SMPTE measurement program. QA has responded immediately and started to look into it and could reproduce the issue in the meantime in their own test. I would trust QA to fix it with the next software version (v. 1.193 has the bug still).
I alerted QA re. the wrong reference frequency the software is using and the resulting 12 dB too good IMD-SMPTE in the QA403 automated IMD-SMPTE measurement program. QA has responded immediately and started to look into it and could reproduce the issue in the meantime in their own test. I would trust QA to fix it with the next software version (v. 1.193 has the bug still).
I was digging a little bit to see what other companies / authors say, who are/were in the business of measuring IMD in audio.
With my (wrong) initial assumption, that both signals of a symmetrical pair (f2 - f1 and f2+ f2) were correlated, whereas signals of different pairs (i.e. f2-2f1 and f2-f1) are not, I found myself in good company.
Look here:
Fundamentals of Modern Audio Measurement
Richard C. Cabot, AES Fellow
Audio Precision, Inc. Beaverton, Oregon 97075, USA
Journal of the Audio Engineering Society, Vol. 47, No.9, 1999, September
Quote:
"SMPTE Intermodulation
The modulation components of the upper signal appear as sidebands spaced at multiples of the lower frequency tone. The amplitudes of the sidebands are added in pairs, root square summed, and expressed as a percentage of the upper frequency level."
Adding in pairs, means linear summing of both signals belonging to the symmetrical pair. Only after that the rms-summing is applied. That would add +6 dB to the dBV amplitude when adding the "other" symmetrical signal buddy of the same pair.
----------------------------------------------------------------------------------------------------------------------------------------------------------------
The same I found in the description of IMD measurement by GRUNDIG (former German radio and hifi gear maker).
Quote:
Messungen an HiFi-Verstärkern nach DIN 45500
D.Elsaesser, Grundig Technische Informationen 1/1970
U = voltage
f1, f2 = fundamental (carrier) frequencies
Quote:

Sorry for the German.
But I think you can easily see, that the Grundig equation to calculate IMD (SMPTE or DIN) exactly mirrors the above instruction (by R. Cabot, AP) to add the sidebands first in pairs and only afterwards apply rms summing.
----------------------------------------------------------------------------------------------------------------------------------------------------------------
----------------------------------------------------------------------------------------------------------------------------------------------------------------
Both calculation methods are in contrast to the rms-summing of all IM signals as described by Rane Corp. and in the paper shown below:
Rane Note 145
Audio Specifications
Dennis Bohn, Rane Corporation, 2000
Quote:
"SMPTE Method
The modulation components of the upper signal appear as sidebands spaced at multiples of the lower frequency tone. The amplitudes of the sidebands are rms summed and expressed as a percentage of the upper frequency level."
----------------------------------------------------------------------------------------------------------------------------------------------------------------
And:
Quote:
"Measurements of Various Intermodulation Distortions (IMD, TD+N, DIM) using Multi-Instrument
By Dr. Wang Hongwei, Virtins Technology, Aug. 18, 2020

That' clearly expressing the method described in the Note of Rane Corp.
It looks to me that one cannot be certain, which method was/is actually applied and IMD results may vary by (at least) 3 dB due to the different understanding how to sum up IM-signal components. In practical implementation, this fundamental topic may not be always of concern, because the audio analyzer works differently than the mathematical treatment. Nevertheless, one would think that there should be consensus on the mathematical treatment of such relatively "simple" phenomenon.
Newer literature seems to prefer the (orthogonal, geometrical) rms-summing of all IM-signals and relating it to the higher frequency carrier.
Older literature seems to prefer the linear summing of the voltages belonging to the same symmetrical pair first and only afterward do the rms-summing of the sums of different pairs.
Obviously there is a discontinuity in the understanding of how the IM-signals total power is made up? New learnings between the 1970ies and today?
With my (wrong) initial assumption, that both signals of a symmetrical pair (f2 - f1 and f2+ f2) were correlated, whereas signals of different pairs (i.e. f2-2f1 and f2-f1) are not, I found myself in good company.
Look here:
Fundamentals of Modern Audio Measurement
Richard C. Cabot, AES Fellow
Audio Precision, Inc. Beaverton, Oregon 97075, USA
Journal of the Audio Engineering Society, Vol. 47, No.9, 1999, September
Quote:
"SMPTE Intermodulation
The modulation components of the upper signal appear as sidebands spaced at multiples of the lower frequency tone. The amplitudes of the sidebands are added in pairs, root square summed, and expressed as a percentage of the upper frequency level."
Adding in pairs, means linear summing of both signals belonging to the symmetrical pair. Only after that the rms-summing is applied. That would add +6 dB to the dBV amplitude when adding the "other" symmetrical signal buddy of the same pair.
----------------------------------------------------------------------------------------------------------------------------------------------------------------
The same I found in the description of IMD measurement by GRUNDIG (former German radio and hifi gear maker).
Quote:
Messungen an HiFi-Verstärkern nach DIN 45500
D.Elsaesser, Grundig Technische Informationen 1/1970
U = voltage
f1, f2 = fundamental (carrier) frequencies
Quote:
Sorry for the German.
But I think you can easily see, that the Grundig equation to calculate IMD (SMPTE or DIN) exactly mirrors the above instruction (by R. Cabot, AP) to add the sidebands first in pairs and only afterwards apply rms summing.
----------------------------------------------------------------------------------------------------------------------------------------------------------------
----------------------------------------------------------------------------------------------------------------------------------------------------------------
Both calculation methods are in contrast to the rms-summing of all IM signals as described by Rane Corp. and in the paper shown below:
Rane Note 145
Audio Specifications
Dennis Bohn, Rane Corporation, 2000
Quote:
"SMPTE Method
The modulation components of the upper signal appear as sidebands spaced at multiples of the lower frequency tone. The amplitudes of the sidebands are rms summed and expressed as a percentage of the upper frequency level."
----------------------------------------------------------------------------------------------------------------------------------------------------------------
And:
Quote:
"Measurements of Various Intermodulation Distortions (IMD, TD+N, DIM) using Multi-Instrument
By Dr. Wang Hongwei, Virtins Technology, Aug. 18, 2020
That' clearly expressing the method described in the Note of Rane Corp.
It looks to me that one cannot be certain, which method was/is actually applied and IMD results may vary by (at least) 3 dB due to the different understanding how to sum up IM-signal components. In practical implementation, this fundamental topic may not be always of concern, because the audio analyzer works differently than the mathematical treatment. Nevertheless, one would think that there should be consensus on the mathematical treatment of such relatively "simple" phenomenon.
Newer literature seems to prefer the (orthogonal, geometrical) rms-summing of all IM-signals and relating it to the higher frequency carrier.
Older literature seems to prefer the linear summing of the voltages belonging to the same symmetrical pair first and only afterward do the rms-summing of the sums of different pairs.
Obviously there is a discontinuity in the understanding of how the IM-signals total power is made up? New learnings between the 1970ies and today?
Last edited:
This linked paper (posted by Bonsai) does not give any useful answer to my question. Says the same as I said before. For independent different (multiple) tones (frequencies) that's clear. Especially, if one assumes (was an explicit restriction in Bonsais linked app-note) that one assumes they are independent.
The question was, why the two solutions f1-f2 and f1+f2 of the linear combination of f1 and f2 were treated as being correlated by one group of authors and uncorrelated by another group of authors. All authors were/are professionals in the audio measurement business. I think nobody here would question that for a company like Audio Precision, right?
The symmetrical pair of sidebands (f1+f2) and (f2-f1) have the same origin (which is the linear combination of f1 and f2) and as a symmetrical pair they are not independent from each other. Isn't it just fair to ask, why they shall be treated as uncorrelated rather than correlated as in the Cabot AP-paper and in the corresponding formula GRUNDIG showed?
Other (newer) papers treat all IM-products, including the signals of the symmetrical pair as being uncorrelated. I have finally accepted that, nevertheless, I am puzzled that even experts did (do?) not uniformly agree on that, as far as it relates to the components of the symmetrical pair. To what extent is science behind it, or practice, or convention?
I think, I have to get used to apparent discrepancies like this.
Last edited:
The paper I mentioned makes it absolutely clear how power tones, and therefore the resultant IMD components, add.
It does not make it clearer, if you repeat yourself without giving more meat to the bones.
The paper says "for independent signals". That restriction is not helpful, because it may not apply in certain conditions and then the formula is invalid.
Again:
The signals
A = f1+f2
and
B = f1-f2
are both combination products of a linear combination and as such they are not automatically independent from each other, even if f1 and f2 are independent. And it's that logic that resulted in the different summing, some of the authors applied as I showed.
I don't defend one position over the other. I am searching for insight.
Last edited:
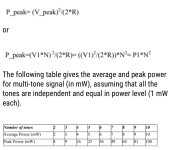
Independent simply means different no matter what the frequency relationship - frequency is not in the formula. Using the formula in the Mini-Circuits paper I tested it on my QA 401 and it held for any frequency combination of equal 2 tones. For a 100 watt amplifier, the max power of 2 equal tones of any frequency relationship within the amplifier passband is 25 W.
- Home
- Design & Build
- Equipment & Tools
- New Audio Analyzer QA403