Regarding Celephant and HD, IIRC according to Doug Self, if the voltage across the cap is less than about 67mV then there is no HD from an electrolytic cap. So the idea is to make the cap large enough to keep the voltage low enough at the lowest frequency of interest so that no HD occurs.
Now my question for @OnAudio
If not HD, what accounts for the sound of Celephant?
Now my question for @OnAudio
If not HD, what accounts for the sound of Celephant?
Happy new year world. Lets call that maybe first principles. Mark ideally these caps should be swappable at the top of an amp just like tubes. Who knows what the ear hears and what the brain makes of it. Maybe the production process does give each cap some properties
Like what, for instance (in engineering terms)?Lets call that maybe first principles.
Mark we can call this a function approximation "according to Doug Self, if the voltage across the cap is less than about 67mV then there is no HD from an electrolytic cap"
Sounds more plausible. There seems can be no such thing as a linear transfer function in absolute terms, hence some limitation of the measurement device. What is the mechanism of distortion in an electrolytic cap?
What makes you assume there is only one? Its a common assumption people make about a lot of things. Just something to consider is all, i amnot making any claims as to a specific number for electrolytics.What is the mechanism of distortion in an electrolytic cap?
However, when an electrolytic is used as a coupling cap, its impedance is much lower when it is driven in reverse polarization. However, reverse polarization of less than approximately 67mV should presumably be okay in terms of HD production.
Still wondering if anyone (especially OnAudio who brought up "Celephant"), knows anything about the properties of electrolytics or other capacitors excluding HD that could affect sound?
Last edited:
Among other things, people claiming that there is an adverse effect used to put the blame on dielectric absorption causing step responses not to be exactly e-t/RC shaped. They didn't explain why small differences from a e-t/RC shape were supposedly worse than the difference between a step and a e-t/RC shape.
In that case wouldn't what matters be if the effective group delay of any time domain waveform change exceeds the threshold of audibility for group delay (at least for the average ear)?Among other things, people claiming that there is an adverse effect used to put the blame on dielectric absorption causing step responses not to be exactly e-t/RC shaped. They didn't explain why small differences from a e-t/RC shape were supposedly worse than the difference between a step and a e-t/RC shape.
https://acris.aalto.fi/ws/portalfiles/portal/66449704/Audibility_of_Group_Delay_Equalization.pdf
I sometimes use a different test for small DA changes in film caps. Requires listening tests though. That said, I know of various ways of measuring DA.
Last edited:
The primary mechanism of distortion in a capacitor is that the capacitance changes with applied voltage. Electrolytics of course are the worst in this regard. This can be mitigated, but not eliminated, by using a capacitor of higher rated voltage.
The base-emitter junction of a transistor does the same thing. If you understand a capacitor as two plates separated by a dielectric, then you can understand how the charges get closer and farther away as the applied voltage changes.
I believe it was Cyril Bateman that thoroughly addressed issues with capacitors, comparing different types and their respective nonlinearities.
https://www.diyaudio.com/community/...tric-absorption-evaluator-the-d-a-boy.371488/That said, I know of various ways of measuring DA.
believe it was Cyril Bateman that thoroughly addressed issues with capacitors, comparing different types and their respective nonlinearities.
All articles are free to read at Linear Audio site:
https://linearaudio.nl/cyril-batemans-capacitor-sound-articles
Nope, not the case, electrolytics usually fare a lot better than non-C0G ceramics, which can lose most of their capacitance with voltage. They also display complex cross-over-like distortion at low signal voltages. C0G (aka NP0) are by contrast some of the most linear devices there are.The primary mechanism of distortion in a capacitor is that the capacitance changes with applied voltage. Electrolytics of course are the worst in this regard.

Re: Dielectric Absorption and general dielectric behavior, please see the attached.
Attachments
-
Review - A new understanding of the dielectric relaxation of solids.pdf2 MB · Views: 91
-
An overview of dielectric properties measuring techniques.pdf628.4 KB · Views: 133
-
Modeling Dielectric Absorption in Capacitors.pdf343.5 KB · Views: 75
-
Cable AC Conductance and Dielectric Polarization & Relaxation Measurements.pdf3.6 MB · Views: 94
Thanks have followed all the contributions here, reasonable explanations seem to have been given for capacitors that sing
In general the entire distortion discussion isn't really relevant if the cone-surround resonance is so bad that it will give a enormous problem in the frequency response.
Going back to my original point, was that a light cone has often a lot more issues as well.
But purely practical speaking it's not very interesting to know and talk about.
Just look at the impedance graph, freq resp and distortion plots and you will see how usable a woofer is or not for a specific application. Additionally look at the Klippel graphs.
The reasons why aren't really relevant at that point, since we are not driver manufactures and just have to choose between things that are available to us.
Re: Dielectric Absorption and general dielectric behavior, please see the attached.
Some good reading in the above. I did some experimentation with biasing electrolytic capacitors using mid point biasing using pairs of caps. The set point voltage was < 100mV... perhaps around 75mV for best sonics. It wasn't the lower voltage the better. No DBT though.
In general I don't trust dielectric materials not to affect sonics in some way, this includes interconnect cables. If signals become low enough even interconnection cables become problematic. The minor bending of a teflon cable between a sensor head and some sensitive electronics overwhelmed the measurement of the relaxation time in a research project. The measurement device was tuned for bias currents < 1 femto Amp or a few hundred electrons per second. Mechanical distortion or vibration can be a problem. Physical size in terms of pickup can be another.
It isn't clear if mechanisms of distortions can't be categorized into linear and non-linear types. A linear distortion can be defined as time shifted reproductions from a zero phase reference signal, whereupon artifacts vary with the same gain as the reference. For simple non-linear transfer functions it was mentioned previously that diminishing signals results in lower relative distortion. The conclusion being that linear distortions will always predominate as signal levels are reduced. The question is when and what artifacts become predominant?
Hi Jan -
Another fantastic article! Thank you. I read it, and read it... along with comparing it to the notes I had written for myself around the linked publication below.
https://benchmarkmedia.com/blogs/application_notes/audio-myth-damping-factor-isnt-much-of-a-factor
The only thing I haven't quite picked up on properly from your article and the cited work from Hegglun surrounds the graph attached along with its accompanying caption and one statement from your article.
First, I want to ensure that I understand the chart (I need to get off my rump and buy the full USB stick of articles, so I can read them all in full form).
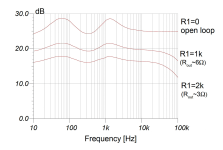
You stated "Ian Hegglun [1] did some work on the effects of amplifier output impedance (and thus DF), which shows that the lower the DF, the more the speaker resonances are suppressed (Figure 2; disregard absolute level differences)."
Is it correct to look at the relative linearity / smoothness of the "peaks" in the chart as the speaker resonances being suppressed?
R1 would have the lowest amount of suppression?
R3 would have the highest amount of suppression?
He doesn't show an estimated Rout for R1 (I'm sure those more skilled know what it is), but I'd assume from the chart, that the Rout for R1 is higher than that of R2.
So, in a very basic tabular presentation, would it be something like this?
If so, that seems to be the opposite of what you've said, but again... I am a complete novice trying to learn. My guess is that I'm missing something about how to interpret / how to discern the speaker resonance suppression from the graph.
Any insight would be greatly appreciated as always!
Edited - One column of my table was missing.
Another fantastic article! Thank you. I read it, and read it... along with comparing it to the notes I had written for myself around the linked publication below.
https://benchmarkmedia.com/blogs/application_notes/audio-myth-damping-factor-isnt-much-of-a-factor
The only thing I haven't quite picked up on properly from your article and the cited work from Hegglun surrounds the graph attached along with its accompanying caption and one statement from your article.
First, I want to ensure that I understand the chart (I need to get off my rump and buy the full USB stick of articles, so I can read them all in full form).
You stated "Ian Hegglun [1] did some work on the effects of amplifier output impedance (and thus DF), which shows that the lower the DF, the more the speaker resonances are suppressed (Figure 2; disregard absolute level differences)."
Is it correct to look at the relative linearity / smoothness of the "peaks" in the chart as the speaker resonances being suppressed?
R1 would have the lowest amount of suppression?
R3 would have the highest amount of suppression?
He doesn't show an estimated Rout for R1 (I'm sure those more skilled know what it is), but I'd assume from the chart, that the Rout for R1 is higher than that of R2.
So, in a very basic tabular presentation, would it be something like this?
| Rout | DF | "Suppression" | |
| R1 | Highest | Lowest | Worst |
| R2 | Middle | Middle | Middle |
| R3 | Lowest | Highest | Best |
If so, that seems to be the opposite of what you've said, but again... I am a complete novice trying to learn. My guess is that I'm missing something about how to interpret / how to discern the speaker resonance suppression from the graph.
Any insight would be greatly appreciated as always!
Edited - One column of my table was missing.
Attachments
Last edited:
- Home
- Design & Build
- Electronic Design
- Myths, tricks and hey, that's neat!