If I had the knowledge to offer an informed answer, I would have, but sadly I'm climbing the steep learning curve myself.well i guess my understanding and question was so far out to lunch that it didn't merit a response.
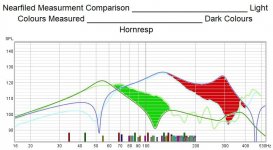
Here's a frequency response measurement done using Keele's nearfield technique summing the two sources and adjusting for area. Brought back to 2.83v/1m, the 50hz sensitivity is around 100db.
Nice and congratulations again. How can you describe its sound? do you like it?
The impedance graphic looks very close to the simulation from 35Hz and up they are overlapping, peaks are in the right places and you have smooth line.
Regarding the acoustic power, part of the graph is very close to the simulation and part of the graphic don't, below 60Hz the response suggests some room reinforcement, for instance, at 40Hz your box is showing 7dB more then predicted. Do you have an image of the environment that you perform the measurement? From 70Hz to 160Hz you have an overlap curve vs simulation and after 160Hz there is a dip not present in the simulation. This dip could be related to the environment and the method you use to sum both sources, but sometimes is hard to get a good environment and tool as diy.
it is the impedance we are looking right?
if so then how is not just like tuning a bass reflex which is an exercise in reducing the impedance peak and convert it to two smaller humps in order to achieve a lower frequency response and restore acoustic output at the resonant frequency?
i keep thinking of an old adage "when the impedance grows the SPL goes"
i would be more concerned if i saw a shift in the frequency... which i would interpret as something is the wrong size...but now this has me wondering if direction of the shift up or down would be better or worse...?
I would recommend an outdoor ground-plane measurement, I use a battery powered amplifier and laptop for this and a local car park that is open and empty at night. The data quality is superb compared to every other method I have tried (Keele summing, mic in box, various 'open' yards). I did a whole bunch of testing using different methods in this thread: https://www.diyaudio.com/community/threads/isobaric-sub-based-on-pyle-plpw15d.345807/

The impedance comparison should end up even closer if you take the driver's semi-inductance parameters into consideration. They can be derived from the DATS-measured impedance curve using an Excel workbook that's available from my site - http://www.diysubwoofers.org/misc/semi-inductance.html
FWIW, a design that's 3dB down at 50 Hz (after EQ) and an Fb that's just above 50 Hz probably doesn't really qualify as a subwoofer... 🙂
This was the sum of two near field measurements. I tried the approach because I was too lazy to drag my gear put into the paddock. The increase below 50hz is phaser related. Below fb, the two sound sources are out of phase, which I didn't account for when summing because I wasn't interested in what the box was doing below that point.Nice and congratulations again. How can you describe its sound? do you like it?
The impedance graphic looks very close to the simulation from 35Hz and up they are overlapping, peaks are in the right places and you have smooth line.
Regarding the acoustic power, part of the graph is very close to the simulation and part of the graphic don't, below 60Hz the response suggests some room reinforcement, for instance, at 40Hz your box is showing 7dB more then predicted. Do you have an image of the environment that you perform the measurement? From 70Hz to 160Hz you have an overlap curve vs simulation and after 160Hz there is a dip not present in the simulation. This dip could be related to the environment and the method you use to sum both sources, but sometimes is hard to get a good environment and tool as diy.
The dip above 160hz is definitely not environmental. The box audibly drops like a rock, regardless of where I’ve measured it.
As for describing the sound, I've never liked throwing adjectives at something that can be represented scientifically, but it's certainty at the fast and punchy end of the spectrum.
Last edited:
I tend to agree, and I have a large farm with plenty of open areas, but not hard reflective surfaces (it's mostly well grassed). Living in a rural area, finding a large empty car park is like finding a field full of cattle in a city.I would recommend an outdoor ground-plane measurement, I use a battery powered amplifier and laptop for this and a local car park that is open and empty at night. The data quality is superb compared to every other method I have tried (Keele summing, mic in box, various 'open' yards). I did a whole bunch of testing using different methods in this thread: https://www.diyaudio.com/community/threads/isobaric-sub-based-on-pyle-plpw15d.345807/
I’d argue that depending on the intended use, it does. After 30 years playing bass guitar through at least that many cabinets (half of them diy), I am certain that 30hz or even 40hz performance is wasted in live sound. This is supported by the increased use of high pass filters in the bass guitar world.FWIW, a design that's 3dB down at 50 Hz (after EQ) and an Fb that's just above 50 Hz probably doesn't really qualify as a subwoofer... 🙂
Regardless, if that’s your criteria, most of the Tham and ROAR boxes aren’t subwoofers.
Small, loud, low. I picked loud and small for this one.
And I'd agree with that assessment. Bass cabinets, yes, but not subwoofers.Regardless, if that’s your criteria, most of the Tham and ROAR boxes aren’t subwoofers.
The dip above 160hz is definitely not environmental. The box audibly drops like a rock, regardless of where I’ve measured it.
It may worth to investigate what is happening. At 300Hz the graphic shown 22dB of difference from measured vs simulated, wider bandwidth is always welcome.
Once you measured each output separately, you could compare each one separably vs the simulation too, do you know how to do it? (in the simulation acoustical power chart, click on tool -> output and select one of them. Maybe looking to the stand alone comparison for both output (Front Horn and Rear Chamber Vent) we may see some tip for what is happening and it may lead us also to find a way to improve the simulation.
Microphone placement might bring some influence in the summation too, If I understand correctly you listened the box while playing and you can perceive the sound loosing SPL above 160Hz even changing box placement, right? If this is right we need to assume that the drop is related to the box design and something is wrong with the model, it will be intriguing.
.
The drop is certainly related to the box design. The dip above 160hz has occurred with nearfield measurements, groundplane at 4m from my house and in an open field 30m from any building.It may worth to investigate what is happening. At 300Hz the graphic shown 22dB of difference from measured vs simulated, wider bandwidth is always welcome.
Once you measured each output separately, you could compare each one separably vs the simulation too, do you know how to do it? (in the simulation acoustical power chart, click on tool -> output and select one of them. Maybe looking to the stand alone comparison for both output (Front Horn and Rear Chamber Vent) we may see some tip for what is happening and it may lead us also to find a way to improve the simulation.
Microphone placement might bring some influence in the summation too, If I understand correctly you listened the box while playing and you can perceive the sound loosing SPL above 160Hz even changing box placement, right? If this is right we need to assume that the drop is related to the box design and something is wrong with the model, it will be intriguing.
.
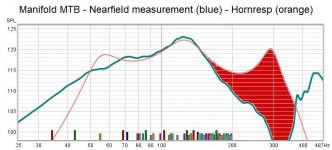
Here's an overlay of both outputs, showing simulations and nearfiled measurements. In some ranges, the correlation is impressive. Certainly the biggest deviation is above 160hz.
An observation I just made on the graph above - it appears that the peak I am seeing at 125hz in my measurements is a result of the port/bottom horn of the enclosure having a much wider bandwidth than predicted (given that the response from the upper manifold is a good match with the simulation at this point). Does anyone have any ideas as to what may be causing this?
Does anyone have any ideas
looks like we are seeing cancellation (red area) in the front horn output and reinforcements (green area) in the rear chamber port.
But comparing with the total acoustical output looks like the reinforcement in the port end at 150Hz, up to this band the response is good, and the dip that happen after 150Hz looks more correlated to the Front Horn and the 22dB difference at 300Hz we see in both graphics (Front Horn Stand Alone or or Total Acoustical Power)
Do you mind to post the hornresp input data and freecad ones? lets check if box dimensions and hornresp data are correctly correlated.
If you are using the version 2 the freecad data are:
Cab Int Width
thickness
baffle
D
height
L1
L2
line1
line2
extangle
The driver placement is offset regarding horn throat, witch has a flat surface that can reflect some frequencies, I don't know if those reflections are causing this cancellations, but once the geometry is very simple, hornresp should simulate very well, the segments area are equivalent but not exactly the same as used in hornresp code I think.
One simple test that may worth doing is to stuffing the Front Horn Throat like indicated in the black area of the attachment #3 with some fiber material, things that could damper the frequencies close to the dip, and see if you perceive any improvement.
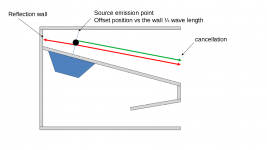
312Hz has a wave length of 1,1m, a 1/4 wave length would be 0,275m. Is this value close to your driver offset placement (D)?
Attachments
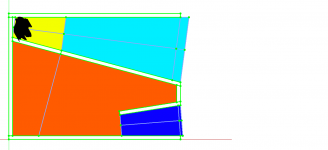
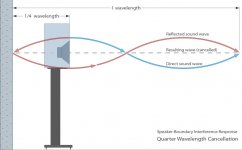
To better illustrate, the cancellation phenomena would be like in the attached image #1 and we can think of this phenomena happening in the front horn as in the attached image #2. I would expect Hornresp to catch this kind of issue in the simulation, lets confirm first so we can ask David to help us.
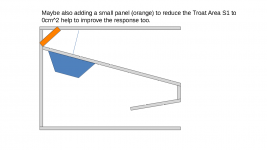
One possible solution would be adding an small angled panel in the throat like in the attached image #3. Check the simulation setting the Horn Throat Area S1 = 0.01cm^2.
If you like it, test before permanent change your box so you can confirm the improvement.
One possible solution would be adding an small angled panel in the throat like in the attached image #3. Check the simulation setting the Horn Throat Area S1 = 0.01cm^2.
If you like it, test before permanent change your box so you can confirm the improvement.
Attachments
I don't think the additional panel will make much of a difference.
That massive cancellation (which might be a good thing in this case, if the intent is to use this build below 200 Hz) is likely a result of either (1) a mismatch between the sim and the build, or (2) some issue with the measurement process, or some combination of both.
The latter can be removed as a possibility by measuring a known system under the same environmental conditions to see if the measurements correlate with what the known system's response is like. For this type of comparison I typically use a simple sealed subwoofer as the "known" system. If the deviation is still observed in the same frequency location, then there's an issue with the measurement process. FWIW, I ran into a similar issue years ago, only to discover that I didn't reset the same EQ that was feeding the amp that was driving the device I was testing (sigh).
Can you post the Hornresp sim that you used for this build?
@laxandredeyed
Could you share the hornresp simulation inputdata and also the box dimensions from FreeCAD?
Could you share the hornresp simulation inputdata and also the box dimensions from FreeCAD?
Did you do basically open baffle boxes or more complex Greg?Right, re HR, some other programs, but have only seen this much damping from box acoustic loading, so assume from ya'll's experience that all my boxes I measured (admittedly not that many) were rigid/massive/sealed enough, so good to finally get confirmation my box building advice over the decades has been/is 'sound'. 😉
Ok. Looked at all the measurements.
Here's my two cents.
Your impedance peaks are in the right places. You pretty much have the driver loaded as per your simulation. As many have rightly stated Hornresp doesn't account for vibrating panels or leaks.
Brian pointed out you could get more accuracy using the Semi-Inductance Model.
Here's the kicker.
There's more going on in your enclosure. You are working both sides of the driver. And you are getting a cancellation null. The outputs of both sides are to close together. Time to start thinking in terms of actual wavelength of the sound you are trying to reproduce. Your dip starting at about 150 is about 343/150= 2.28 metres full wavelength. So half and even quarter wavelength will start to effect the output. Becasue the back side of the output is pretty much 180 degrees out of phase or time with the front side you will get some cancellations. But my guess is you have an enclosure that is not physically the same as your simulation. A few tricks at the expense of output is the dampen the rear side enclosure with Rockwool or fiberglass, even polyester. It will change the output. And perhaps reduce the extent of EQ you are using at this time. That is only to chase the cause. If I am right the enclosure would do the most with having the low end side as far from the higher frequency side as you can manage. Be it physically or manipulated via a phase delay at the correct frequency.
Mark
312Hz has a wave length of 1,1m, a 1/4 wave length would be 0,275m. Is this value close to your driver offset placement (D)?
@laxandredeyed
Could you share the hornresp simulation inputdata and also the box dimensions from FreeCAD?
That massive cancellation (which might be a good thing in this case, if the intent is to use this build below 200 Hz) is likely a result of either (1) a mismatch between the sim and the build, or (2) some issue with the measurement process, or some combination of both.
Ok guys - I've got egg on my face here. I just double checked my Hornresp data and all looked pretty good. I then went and measured the driver location in the top horn/manifold of the box I constructed and had my lightbulb moment.
When building the cab, to get the driver in and out without rear mounting it with an access panel, I had to move it closer to the mouth. I never adjusted the simulation after this
Running the numbers again (with the correct driver offset), the sharp drop at 300hz occurs in the simulation. Note that the driver offset is indeed 1/4 wavelength of the null in the simulation, as LORDSANSUI suggested.
I can't seem to find my REW measurements for this cabinet, so we can overlay the revised simulation and measurement, but looking back at pictures I posted earlier, there seems to be good alignment between the two.
I didn't use Freecad for this, rather Autocad for something dirty and fast as it's a program I'm accustomed with. Panel thickness is 17mm, panel width is 410m
- Home
- Loudspeakers
- Subwoofers
- MTB Manifold - Help Interpreting Impedance Measurements