Sounds interesting, but nonetheless there is no "truncated bit" of the IR resulting from a deconvolution that I can think of that would satisfy kgrlee's question:Some years back, I came up with a Farina-like test for some IM orders using two simultaneous sweeps (frequency separated by a fixed percentage, and sweeping backwards high to low). That brought out IM "impulse responses" in negative time (but also in positive time, so not as clean for frequency responses).
Could we just convolve the truncated bit with our stimulus to get our residual?
Fig 4 on p8 "Loudspeakers for AEC.pdf" is a spectrogram of a 15s Farina sweep. Looks like a swept narrow band filter to me 😊I would argue that the collection of harmonics is a welcome side effect of the particular group delay profile of a log sweep and not a filtering process.
This is the Matched Filter you convolve with your measured signal. If you now truncate to get your 'model IR' (which is presumed LTI), convolve that with your measured signal and then subtract, you can see where the deep blue trench comes from.
This acts on the Harmonics as well but at different 'times'. You get this with a Linear (TDS / Heyser) sweep as well but the Farina sweep just puts the results into nice separate IRs.
If the "noise & intermod is distributed throughout the IR", that's 0.4/15s = 0.027 of the total 'noise & intermod' ie reduce the 'noise & intermod' by 0.23dB [20*log(1.0270] OK. I should be using 10*log... bla bla cos it's power but I think you get the picture.It doesn't make sense to me. If the LTI response came from a log sweep, for example, harmonic distortions are shifted to negative time but intermodulation and noise have effects that are distributed throughout the IR and are not separable from the LTI component.
The practical 'proof' would be to repeat DcibeL's measurements (or a similar speaker) in #109, #110 and check with REW Residual obtained with
- FSAF and subtraction as presently programmed to compare with
- the much simpler method I've proposed.
So we should compare the Residuals using both methods with 15s music. That should satisfy those who want to use REW Residual to listen to yuckiness of speakers.
I should be clearer."truncated bit" of the IR resulting from a deconvolution that I can think of that would satisfy kgrlee's question:
The "truncated bit" is what you cut out of the full raw IR (from the first deconvolution) to get the 'model IR'.
It's the stuff after the 'model IR' ... which for a Farina sweep, includes the second half of the FFT record with the Harmonic IRs
Last edited:
Member
Joined 2003
This measurement was just a loopback of my amplifier output, with no load. Of course, the residual is just transformer hum, typical of most low-mid range amplifiers with a linear power supply. Since the hum is a constant unwanted noise, it is captured very clearly in FSAF.View attachment 1373622View attachment 1373623View attachment 1373624
I am truly terrible at names. But a gentleman posted a FLAC file of what he measured. This is the spectral content of it. Looks to be power line harmonics as the main contributors. This is Musical Spectrum Analyzer plugin in Foobar2000. This is kind of what happens. Trying to extract all the noise that is generally masked.
The situation is much popular music is that distortion of the harmonics is the basis for the sound. This is even true in Classical music, adding beat frequencies and harmonics is a tried, tested and useful method to make sound more impressive. Reeds on pipe organs, over blown brass instruments.
I understood what you meant, but even if it worked (which I'm doubtful of) it would still only provide a residual which was valid for that sweep stimulus. It would not and could not extract the non-linear behaviour of the system in a way that could be applied to any other signal.The "truncated bit" is what you cut out of the full raw IR (from the first deconvolution) to get the 'model IR'.
It's the stuff after the 'model IR' ... which for a Farina sweep, includes the second half of the FFT record with the Harmonic IRs
It would be nice to be able to use a different 'model IR' to get the residual in REW, rather than just the one derived from the stimulus.
I see that now. The prime example is the Harmonic IRs in the 'truncated bit' from Angelo's method only generates the correct harmonics cos the original stimulus has the right frequencies at the right time. They can't possibly extract yucky stuff from another stimulus.but even if it worked (which I'm doubtful of) it would still only provide a residual which was valid for that sweep stimulus. It would not and could not extract the non-linear behaviour of the system in a way that could be applied to any other signal.
Mea culpa, mea culpa, mea maxima culpa .. for pontificating from the wrong orifice.

But I still think we can do this ... from a long IR derived from the same stimulus of course 😊Could we just convolve the truncated bit with our stimulus to get our residual?
That's torture, awful. Nothing I would like to have singing in the background but probable do have.
Recording circumstances?
//
Recording circumstances?
//
The "gray noise" file from wikipedia https://en.wikipedia.org/wiki/Grey_noise was used as excitation file with REW FSAF. As REW does not play .ogg it was converted to .wav with audacity. The (dynamic omnidirectional) microphone was very close to the loudspeaker cone (sealed box). The only difference between the files was the excitation high pass filter set in REW FSAF, 10Hz/60Hz. The level was much lower than x-max, same setting for both, far away from clipping anything. The residual files were then grabbed from the temp folder and upped 36dB with audacity. The background noise is my cheeky heater.
Questions left?
Best regards
Bernd
Questions left?
Best regards
Bernd
That's high frequency crap crap. What's the driver, or what is it's Le and Re? If it was a sub with high Le this particular crap would be less? Or with added series impedance as usual.
@bwaslo Was this incorporated into a release of Praxis or some other?
I'd like to test ESS, FSAF and your implementation empirically, and compare and contrast.
I've somewhat revived Praxis into a free version over the past few months, called PraxisFREE (clever, huh?). Runs in Windows. Because of some lost files, though, I had to take Praxis' scripting ability out.
(Download from ; https://www.libinst.com/FreeAppDownloads/).
This thread coincidentally brought up the old "Distortion Isolation" Praxis script, so I spent much of yesterday afternoon doctoring it into a guided measurement function in PraxisFREE. When I get more play time, I'll see about doing an isolation of a loudspeaker current distortion and posting that.
(I don't know how well this compares to the FSAF isolation process, I haven't had time to try that out. I don't often get to go down to the lab and play these days.)
If you want to play:
- The Distortion Isolation thing in Praxis depends on sample matching between "Record" and "Play" (a.k.a. "capture" and "render", in Windows-speak) streams. So it only works with audio interface devices ("sound cards") that have ADC and DAC in the same unit and using the same clock source.
-- I was running the process yesterday with a Presonus Studio 24C, which did great.
You'd think that would be universal, but isn't. For instance, devices using the old TI PCM2900 chip , like the Behringer UCA202, for some reason use entirely different clocks for recording and playing, they don't even track each other over time.
- The sample matching thing (called "Synchronous" type measurements in Praxis) needs a cable patched from the DAC L channel to the ADC R channel, so the software can track samples. Then, the DAC R channel drives whatever you are testing, and the ADC R picks up the response.
- After installing PraxisFREE, run the program, it will initially ask what ADCs go with which DACs. You don't need to do the calibration processes for Distortion Isolation.
- Then go to the Help menu on the Main Form, find the item "Distortion Isolation Guided Measurement". It should be pretty much self-explanatory from there.
A good length of a WAV file, at 48ksps, would be about 20 seconds, you can use something like Audacity to prepare them (or you can do it in PraxisFREE, but probably Audacity is simpler for that). Longer or higher rate files takes longer to process, shorter is quicker, of course. Best to use the same sample rate in PraxisFREE as the WAV file uses (there's a little form for selecting that).
The program has a little applet to playback the waveforms if you want.
Have Fun.
Saw Panio had thumbs'd-up this and reread my post and then spotted a BAD error --
"cable patched from the DAC L channel to the ADC R channel, so the software can track samples"...
That should be from DAC R channel to ADC R channel. Sorry bout that.
I think I got the details right in the in-program instructions though.
"cable patched from the DAC L channel to the ADC R channel, so the software can track samples"...
That should be from DAC R channel to ADC R channel. Sorry bout that.
I think I got the details right in the in-program instructions though.
Ok, Management has given you the what for..... talk ☺️"cable patched from the DAC L channel to the ADC R channel, so the software can track samples"...
That should be from DAC R channel to ADC R channel. Sorry bout that.
I think I got the details right in the in-program instructions though.
If I had a buck for every time I did similar I'd have me a burger once a month!
Just a reminder that the real instruments sound like this

Those are viola, violin, bassoon and horn. Grand piano plays 30 harmonics from each key, and 4 keys at once will be over 100. An orchestra has 50 of those instruments playing together. Nothing before FSAF could throw anything remotely of this complexity into measurement, bravo!
I have no good microphone. If you want to try, I would recommend 2 pieces - Verdi Requiem and Saint-Saence Organ symphony. They mix orchestra, organ and choir, completely covering the most complex music case possible.
I have a garbage mic, cannot do any of this.https://www.roomeqwizard.com/betahelp/help_en-GB/html/fsafmeasurement.html
USB microphones which rely on the USB clock are not suitable for FSAF measurement as the USB clock is not stable. That means, for example, UMIK-1, UMM-6 and Omnimic are unsuitable for FSAF measurements. It is possible to use a USB mic which has an internal clock source, such as UMIK-2.
I have only UMIK-1 mk2
But a reminder - there are some dedicated USB cards with separate power supply and high precision clock, much better than the USB from the computer motherboard. I use one of those and the effect is noticeable. They are like $25 but I don't have a link to give you, should be easy to find.
Hi everyone. I'm a little late to the party - but better late than never.
When first reading up on the topic, what intrigued me by far the most was being able to separate the residuals (everything but the fundamental) from the measurement and listen to it. I performed my first measurements & residual listening tests a couple of days ago, wasn't very convinced by the results, and decided to take a deeper dive.
I've read the REW documentation on FSAF, this entire 10 page thread, as well as the 14 page thread on AVNirvana - so I'm informed on the basic principles of FSAF & its implementation in REW, as well as up to date on user experiences / experimentations so far.
There are plenty user measurements / comparisons demonstrating that FSAF can accurately record the frequency response of a speaker with various types of signals. But other methods have offered the possibility of FR measurements with various types of signals, including music, for decades, so that's nothing revelatory.
What interests me, and probably most other users as well, is nonlinear distortion. The clearest evidence so far I've seen that FSAF in REW works in that regard are @DcibeL 's measurements here, which clearly demonstrate FSAF accurately depicting the distortion characteristics (spikes, dips, ..) of the DUTs. I'll give credit to the proper method of comparison, displaying harmonics at the harmonc frequency instead of at the fraction of the multiple, which is what I shall also employ in my comparison.
My FSAF trials:
To test if FSAF accurately records nonlinear distortion, I used the basic principles of nonlinear distortion, of a speaker having characteristic distribution, as well as per definition increasing distortion with increasing SPL. The type of measurement was acoustic. Control measurements were taken using established methods at two fixed SPL, to document the DUT's distortion distribution, as well as distortion increase between the two SPLs.
FSAF would have to at least come close to depicting this pre-established distortion distribution & level.
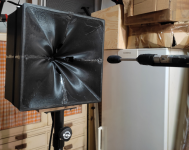
DUT is a Solana Topmod, microphone an Isemcon EMX-7150. Measurement setup is Indoor, 4pi; measurement distance 0,25m ("semi-nearfield", for decent direct to diffuse sound ratio). Lower SPL level was 110 dB @ 0,25m, higher SPL level 125 dB. To maintain an electronics noisefloor as constant as possible, I adjusted the microphone pre-amp level for the 15 dB difference between the two levels.
Control measurements:
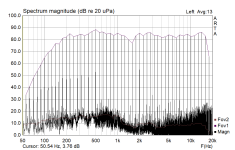
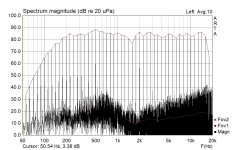
First, I performed Multitone measurements in ARTA (why ARTA - simply because that's the software I'm used to). Multitone measurements record harmonic distortion, intermodular distortion, and all other noise, just as FSAF does. Left is the lower, right the higher SPL. We can observe a problem area in the ~500-1000 Hz area, as well as the typical rising distortion of the compression driver towards higher frequencies; as expected, both are more pronounced in the higher level measurement:
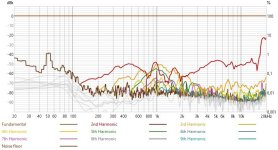
Now harmonic distortion via a sine sweep in REW; shown as relative values, and, as stated earlier, at the harmonic frequency; again left lower level, right higher level; very similar problem areas are visible, as well as a similar distortion increase in the higher SPL measurement:
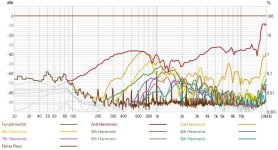
FSAF measurements:
Sweep (REW's standard sweep, recorded and imported as file); IR length standard value (500ms), timing marker used; again left lower, right higher SPL:
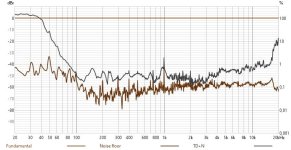
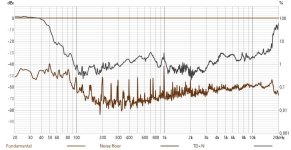
PN White; IR length standard value (500ms), timing marker used:
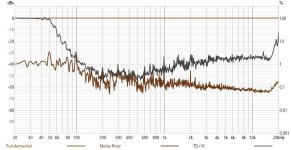
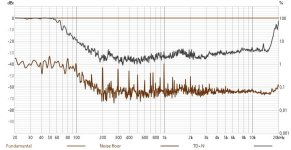
PN White; IR length standard value (500ms), timing marker not used:
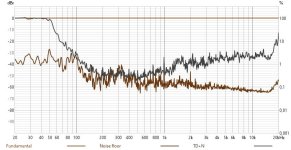
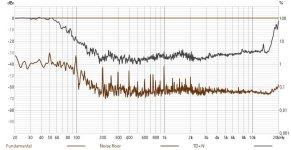
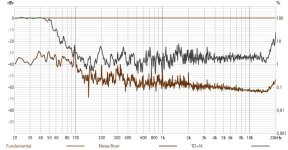
PN White; IR length minimum value (100ms), timing marker not used:
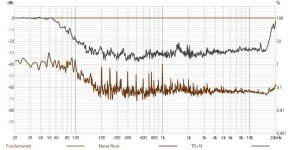
Music (20 seconds of the main part of MGMT - Little Dark Age); IR length standard value (500ms), timing marker used:
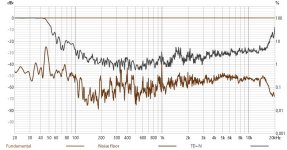
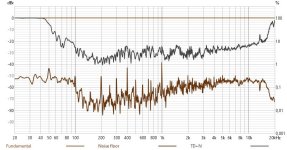
.. and the spectrum of the residuals:
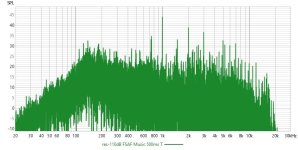
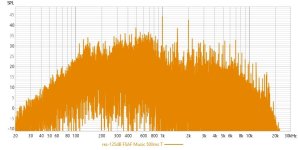
Commentary:
Good news: all FSAF measurements with all settings and signals record increased distortion from the low to the high SPL measurement. Also, FSAF with a sweep reproduces the distortion characteristic (distribution over frequency) of the control measurements pretty well, especially in the higher SPL measurement.
Maybe not so good news: between the types of signals, and settings, correletation tends to be poor. Especially the PN measurements with short IR show almost nonsensical results - barely any difference in distortion over frequency. And interestingly, while the PN measurements at the lower SPL show somewhat meaningful distortion distribution, the higher SPL PN measurements again show a nonsensical almost flat line.
Now, partially that's due to different frequency spectrum distribution, maybe also crest factor, of the signal - but to a large extent, as I said, the results are nonsensical.
I emphasize again that the pre-amp gain was adjusted for the difference between the low and high SPL measurement, so there wasn't any clipping or similar that could explain that behavior; frequency response results also matched on the high and low SPL measurement for every run. I'll also add that this behavior was 100% reproducible, as, when anything is even slightly suspect, I re-run the measurement to make sure everything is in order.
As for the residuals of the measurement with music, I'm also including them as .wav in the attachments. Some of what is measured & heard is naturally the remaining room reflections. Other than that, I don't quite know what to make of what I hear - multitone as well as harmonic distortion should sound diffuse and bright, but what I hear in the residual is what seems like the original music track, with a little clipping and echo put on it. So, again, a result that doesn't inspire me with high confidence.
There's some fluctuations in there as well that seem like timing issues, though I'm using a single interface, which I previously checked for time shift, which it doesn't seem to suffer from.. which is again weird.
So, all in all, for me, FSAF is still looking like a potentially valuable tool - but one that might need yet a bit more work & standardization put into it until we can confidently put it to use.
When first reading up on the topic, what intrigued me by far the most was being able to separate the residuals (everything but the fundamental) from the measurement and listen to it. I performed my first measurements & residual listening tests a couple of days ago, wasn't very convinced by the results, and decided to take a deeper dive.
I've read the REW documentation on FSAF, this entire 10 page thread, as well as the 14 page thread on AVNirvana - so I'm informed on the basic principles of FSAF & its implementation in REW, as well as up to date on user experiences / experimentations so far.
There are plenty user measurements / comparisons demonstrating that FSAF can accurately record the frequency response of a speaker with various types of signals. But other methods have offered the possibility of FR measurements with various types of signals, including music, for decades, so that's nothing revelatory.
What interests me, and probably most other users as well, is nonlinear distortion. The clearest evidence so far I've seen that FSAF in REW works in that regard are @DcibeL 's measurements here, which clearly demonstrate FSAF accurately depicting the distortion characteristics (spikes, dips, ..) of the DUTs. I'll give credit to the proper method of comparison, displaying harmonics at the harmonc frequency instead of at the fraction of the multiple, which is what I shall also employ in my comparison.
My FSAF trials:
To test if FSAF accurately records nonlinear distortion, I used the basic principles of nonlinear distortion, of a speaker having characteristic distribution, as well as per definition increasing distortion with increasing SPL. The type of measurement was acoustic. Control measurements were taken using established methods at two fixed SPL, to document the DUT's distortion distribution, as well as distortion increase between the two SPLs.
FSAF would have to at least come close to depicting this pre-established distortion distribution & level.
DUT is a Solana Topmod, microphone an Isemcon EMX-7150. Measurement setup is Indoor, 4pi; measurement distance 0,25m ("semi-nearfield", for decent direct to diffuse sound ratio). Lower SPL level was 110 dB @ 0,25m, higher SPL level 125 dB. To maintain an electronics noisefloor as constant as possible, I adjusted the microphone pre-amp level for the 15 dB difference between the two levels.

Control measurements:
First, I performed Multitone measurements in ARTA (why ARTA - simply because that's the software I'm used to). Multitone measurements record harmonic distortion, intermodular distortion, and all other noise, just as FSAF does. Left is the lower, right the higher SPL. We can observe a problem area in the ~500-1000 Hz area, as well as the typical rising distortion of the compression driver towards higher frequencies; as expected, both are more pronounced in the higher level measurement:


Now harmonic distortion via a sine sweep in REW; shown as relative values, and, as stated earlier, at the harmonic frequency; again left lower level, right higher level; very similar problem areas are visible, as well as a similar distortion increase in the higher SPL measurement:


FSAF measurements:
Sweep (REW's standard sweep, recorded and imported as file); IR length standard value (500ms), timing marker used; again left lower, right higher SPL:


PN White; IR length standard value (500ms), timing marker used:


PN White; IR length standard value (500ms), timing marker not used:


PN White; IR length minimum value (100ms), timing marker not used:


Music (20 seconds of the main part of MGMT - Little Dark Age); IR length standard value (500ms), timing marker used:


.. and the spectrum of the residuals:


Commentary:
Good news: all FSAF measurements with all settings and signals record increased distortion from the low to the high SPL measurement. Also, FSAF with a sweep reproduces the distortion characteristic (distribution over frequency) of the control measurements pretty well, especially in the higher SPL measurement.
Maybe not so good news: between the types of signals, and settings, correletation tends to be poor. Especially the PN measurements with short IR show almost nonsensical results - barely any difference in distortion over frequency. And interestingly, while the PN measurements at the lower SPL show somewhat meaningful distortion distribution, the higher SPL PN measurements again show a nonsensical almost flat line.
Now, partially that's due to different frequency spectrum distribution, maybe also crest factor, of the signal - but to a large extent, as I said, the results are nonsensical.
I emphasize again that the pre-amp gain was adjusted for the difference between the low and high SPL measurement, so there wasn't any clipping or similar that could explain that behavior; frequency response results also matched on the high and low SPL measurement for every run. I'll also add that this behavior was 100% reproducible, as, when anything is even slightly suspect, I re-run the measurement to make sure everything is in order.
As for the residuals of the measurement with music, I'm also including them as .wav in the attachments. Some of what is measured & heard is naturally the remaining room reflections. Other than that, I don't quite know what to make of what I hear - multitone as well as harmonic distortion should sound diffuse and bright, but what I hear in the residual is what seems like the original music track, with a little clipping and echo put on it. So, again, a result that doesn't inspire me with high confidence.
There's some fluctuations in there as well that seem like timing issues, though I'm using a single interface, which I previously checked for time shift, which it doesn't seem to suffer from.. which is again weird.
So, all in all, for me, FSAF is still looking like a potentially valuable tool - but one that might need yet a bit more work & standardization put into it until we can confidently put it to use.
Attachments
Last edited:
Why so loud? How's the behavior at the more "sane" SPL levels?110 dB @ 0,25m, higher SPL level 125 dB.
It looks to me like the same curve only pushed up some. Does the overall observed problem character remain for any SPL or just levels over 100db?We can observe a problem area in the ~500-1000 Hz area, as well as the typical rising distortion of the compression driver towards higher frequencies; as expected, both are more pronounced in the higher level measurement:
Maybe at 1W in it's great?
This wasn't a speaker test. The type of speaker didn't matter much - it just happened to be the one set up on my speaker stand and connected to the amp at that time. The only real importance of the speaker (DUT) was to have some recognizeable characteristic to its nonlinear distortion that would be able to be captured by any type of nonlinear distortion measurement method - FSAF, or other, more "traditional" methods. The lower of the two SPLs was chosen as a minimum value that would show nonlinear distortion exceeding the noisefloor, and the higher was chosen at a value showing a clear increase in nonlinear distortion to the lower SPL one, to make them easily distinguishable in the measurement results.
In a alternative universe, the residual is complete silence...
I stopped because my room had too much influence. My next step is to move to where wildlife or traffic aren't affecting my outdoors measurements. Or to build my own anechoic test chamber.
One observation from @DcibeL 's FSAF testing is that distortions are MUCH reduced by use of high pass filters on the typical 5" midwoofer, and gives compelling evidence to why a 3-way may be preferable over a 2-way.
- Home
- Loudspeakers
- Multi-Way
- Measuring speakers using music (Michael Tsiroulnikov's FSAF)