Maybe a little test jig might shed some light.
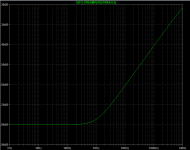
Shown below is an 80 dB attenuator (attenuation = R2/R1) that begins to poop out around 1 kHz. When the capacitive reactance of C1 falls below the resistance of R1, signal current starts to flow in the upper branch and attenuation starts to decrease. C1 = 750pF has a capacitive reactance of 200K ohms at 1.06 kHz, so that's where the rolloff (frequency) is found on the frequency response plot.
{Resistor R3 is merely a voodoo component, completely unnecessary in theory, but reassuring in practice, just in case the function generator's output impedance gets weird at high frequencies. Me, I'd leave R3 in the circuit. You, can do as you like. Now that I look at the schematic, it seems better voodoo to interchange the order of R3 and C1: put R3 next to the signal generator. They're equivalent in theory, but maybe not in voodoo!}
Naturally you can change the resistance ratio and get different amounts of attenuation. You can also change the R1*C1 timeconstant to move the corner frequency up or down. Perhaps a couple of these attenuator jigs might help you discover whether the measurement gear is giving untrustworthy results.
_
Attachments

Ok I don't have as extensive a parts box as you guys. Change R1 to 100k, R2 to 18 and C1 to 4.7n. I make that a 74.8dB attenuator with a 3dB freq of about 327Hz.
As it is very late here I just coupled my signal generator to this jig and connected it directly to my sound card as an interim test.
I set the signal generator to 1Vpp = about -9dBV so the figures below need to be adjusted by 9dBV. (Hmm I think that answers another question I had at one point...) Sorry I should have set it higher to make the following a little bit easier.
Hz dBV
50 -83.8
100 -83.6
200 -83.0
300 -82.3
400 -81.3 (not off 3dB+)
500 -79.4
1k -74.6
5k -60.9
10k -55.6
20k -48.5
30k -45.6
40k -42.9
50k -41.0
60k -39.9
70k -38.1
80k -38.2
90k -36.4
As I was in a rush I didn't shield the jig. It merely sat on my desk with the clips from my signal generator attached.
50Hz looks about right -83.8+9= -74.8
By 400Hz it should be around -71-9 = -80 so a bit off there
1kHz should read circa -65-9 = -74 so not that far off given -74.6
1kHz to 10kHz is a delta of 19dB (rather than 20dB) with 10kHz sitting at -55.6+9=-46.6 versus a modelled -45.5 or so.
10kHz to 90kHz suggests things are on track for a circa 20dB delta. 90kHz reads -36.4+9 = -27.4 versus a modelled circa -26.8
Not perfect but not bad?
I need to hit the sack now.
Last edited:
Out of interest, is it reasonable to expect the battery drain on the pre-amp to be considerably lopsided? Last week I accidentally left the pre-amp on overnight and drained the twin pairs of 9V packs considerably. Today, I think I ran out of headroom on the +ve rail and need to pick up more batteries. I'm now at -12.8V on -ve rail and the +ve rail fell very rapidly from about 9V last night to just over 3V now, effectively terminating abruptly the measurement sequence I was doing.
FWIW here is as far as I got. 10mVpp (-49dBV) input from my signal generator -> -74.8dB test jig -> sound card. Nominal 1000 gain for the preamp entered in ARTA.
Hz ARTA Reading dBV Adj for 49dBV
50 -122.5 -73.5
100 -122.7 -73.7
200 -121.6 -72.6
300 -122.2 -73.2
400 -120.4 -71.4
500 -118.8 -69.8
600 -117.1 -68.1
700 -116.0 -67.0
800 -115.1 -66.1
900 -114.5 -65.5
1k -114.2 -65.2
2k -108.7 -59.7
3k -104.9 -55.9
4k -103.3 -54.3
5k -101.0 -52.0
6k -99.1 -50.1
7k -98.7 -49.7
8k -97.0 -48.0
9k -95.7 -46.7
10k -95.9 -46.9
I will redo the test once I have new batteries. However it is worth noting the reading at 50Hz is close to expected - likely, as suggested in the test described in post 4 the actual preamp gain is a bit off nominal. 1kHz is closer to modelled -65dBV. 1k to 10k is a delta of 18.3dB rather than 20dB but given the preamp conked out while measuring 30kHz perhaps this reading was affected. Nonetheless we're close to the 20dB per decade rolloff expected.
New batteries. Did the test again. Lower frequencies a little different but not dramatically so. Upper frequencies largely the same.
10mVpp (-49dBV) input from my signal generator -> -74.8dB test jig -> sound card. Nominal 1000 gain for the preamp entered in ARTA.
Certainly this side of the test setup is capable of recognising a 20dB per decade change in dBV.
Hz ARTA Reading dBV Adj for 49dBV
50 -123.9 -74.9
100 -123.7 -74.7
200 -123.1 -74.1
300 -122.4 -73.4
400 -121.4 -72.4
500 -119.5 -70.5
600 -118.0 -69.0
700 -116.8 -67.8
800 -115.8 -66.8
900 -115.2 -66.2
1k -114.2 -65.2
2k -109.0 -60.0
3k -105.0 -56.0
4k -103.3 -54.3
5k -101.0 -52.0
6k -99.1 -50.1
7k -98.7 -49.7
8k -96.9 -47.9
9k -95.6 -46.6
10k -95.8 -46.8
20k -88.7 -39.7
30k -85.8 -36.8
40k -83.0 -34.0
50k -81.2 -32.2
60k -80.0 -31.0
70k -78.3 -29.3
80k -78.3 -29.3
90k -76.6 -27.6
For good measure I also tested 0.5Vpp input from my signal generator -> approx -15dBV. Results were basically the same.
Results in post #44 seem to show 19dB/decade which is a good approximation of 20dB/decade
0.6kHz -69dB
6.0kHz -50dB
60kHz -31dB
0.6kHz -69dB
6.0kHz -50dB
60kHz -31dB
Yup. I am having a hard time finding fault with this test setup.
One could always use a lower stimulus. I would have thought 1Vpp okay subject to the rail driver being able to charge the regulator's input capacitance and its load being able to discharge it, and of course also subject to the preamp not clipping or also having slew rate issues. Here I was trying to measure -139dBV - not far above the noise floor. 0.5Vpp stimulus would have that residual signal down another 6dBV. (Those results need to be adjusted for a -9dBV stimulus versus 0dBV.)
I used 1V to be consistent with Walt Jung's 1995 articles. Some folks have since suggested that this may be too large a "disturbance" signal.
One could always use a lower stimulus. I would have thought 1Vpp okay subject to the rail driver being able to charge the regulator's input capacitance and its load being able to discharge it, and of course also subject to the preamp not clipping or also having slew rate issues. Here I was trying to measure -139dBV - not far above the noise floor. 0.5Vpp stimulus would have that residual signal down another 6dBV. (Those results need to be adjusted for a -9dBV stimulus versus 0dBV.)
Attachments
Yet it seems to say that PSRR(60 kHz) equals PSRR(6 kHz) even on the least sophisticated voltage regulators. Is that what SPICE predicts?Yup. I am having a hard time finding fault with this test setup.
To be fair it measured 11dBV difference for STM's LM317T-DG (with or without the preamp) 5kHz->50kHz. I did not record 6kHz. (Posts 25 and 33 above.) The disturbing thing is that the decline in PSRR was only 11dB and not much further decline was recorded from there.
TI's measurement of the LM317 in Fig 7 here. More as expected:
http://www.ti.com/lit/an/slyt547/slyt547.pdf
We've tested the sound card independently and the sound card and preamp combined. We have observed the input to the regulator under test and noted that the 1Vpp stimulus remains consistent. A pure uneducated guess, but could it have something to do with the regulator load?
Last edited:
Having eliminated as potential causes everything downstream of the reg under test and its resistor load (i.e. sound card and measurement amplifier) I looked again at the rail driver. Tests of the sound card and measurement amp were done by coupling my signal generator directly to them. As a quick additional test of the rail driver I added a simple 74.8dB attenuating voltage divider at its output (in lieu of a regulator). Not surprisingly the response was flat at close to the expected level of attenuation (and the rail driver generated 1Vpp across all test frequencies). (I still think the nominal gain of 1000 for the preamp is a bit too high - 0.8-1.0dB or so.)
A more useful test would be to do the above but with the rail driver charging a 470nF cap (the biggest input capacitance of the regulators tested). For this I need to construct a suitably-sized resistive load at its output. With 18V +-1V at its output, the two 12R 10 watt resistors I used at the output of the 12V regulators is probably not enough resistance.
A more useful test would be to do the above but with the rail driver charging a 470nF cap (the biggest input capacitance of the regulators tested). For this I need to construct a suitably-sized resistive load at its output. With 18V +-1V at its output, the two 12R 10 watt resistors I used at the output of the 12V regulators is probably not enough resistance.
Last edited:
Audio Precision
https://www.ap.com/technical-library/measuring-psrr-with-ap2700/
you have to register on their website for this:
https://www.ap.com/download/technote-106-measuring-psrr-power-supply-rejection
The latter shows how to use a Jensen JT-123-BLCF transformer for PSRR measurement. It can be used up to around 600mA.
Since i built mine the price of the transformer has doubled!
Attachments
Thanks Jack. Why do I have the feeling that you and Mark know the answer to the issue here while I poke along at a snail's pace? 🙂
To be fair to myself with regard to speed, I've been busy completing my first amp build.
One of the great features of the AP2700 setup is that the stimulus is constantly monitored and PSRR is constantly calculated as the ratio of AC sim to AC out of DUT. It will always be more accurate.
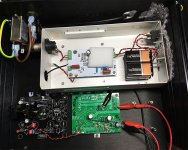
My setup doesn't have this constant monitoring of the stimulus and automatic calculation of the ratio. It injects a stimulus into the high impedance Vref pin of an op amp driving a high current capable pass transistor. This rail driver produces 18Vout with a ripple of 2.6x the input stimulus riding on top. The high impedance of the injection point means the signal generator can easily drive it and the rail driver has plenty of current drive capability to supply the reg-DUT load and charge its input capacitance.
While not automatic, during testing for PSRR the input ripple has been monitored and shown to remain at constant 1Vpp within a few mV (according to my scope Vpp function). There's no droop in the stimulus at any frequency with reg-DUT and its load attached. I'll take that trade for a couple of quid cost versus a few tens of thousands. So the ripple creation stimulus side of my test setup would seem to be fine.
To be fair to myself with regard to speed, I've been busy completing my first amp build.
One of the great features of the AP2700 setup is that the stimulus is constantly monitored and PSRR is constantly calculated as the ratio of AC sim to AC out of DUT. It will always be more accurate.
My setup doesn't have this constant monitoring of the stimulus and automatic calculation of the ratio. It injects a stimulus into the high impedance Vref pin of an op amp driving a high current capable pass transistor. This rail driver produces 18Vout with a ripple of 2.6x the input stimulus riding on top. The high impedance of the injection point means the signal generator can easily drive it and the rail driver has plenty of current drive capability to supply the reg-DUT load and charge its input capacitance.
While not automatic, during testing for PSRR the input ripple has been monitored and shown to remain at constant 1Vpp within a few mV (according to my scope Vpp function). There's no droop in the stimulus at any frequency with reg-DUT and its load attached. I'll take that trade for a couple of quid cost versus a few tens of thousands. So the ripple creation stimulus side of my test setup would seem to be fine.
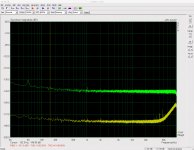
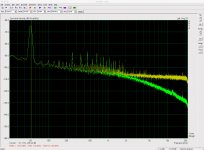
A curious thing happened today while measuring the (currently not so great) noise in my amp build. See attached. I shorted the input to the amp with a 100 ohm resistor. I then measured with the Groner preamp (green trace) and then with a direct connection to the sound card (yellow trace). The former has a 20dB per decade rolloff from 2k-20kHz. There was no such rolloff if the input to the amp was directly shorted....
Attachments
A more useful test would be to do the above but with the rail driver charging a 470nF cap (the biggest input capacitance of the regulators tested).
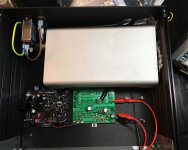
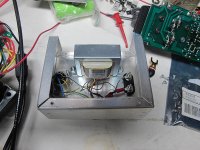
So I added a 470nF cap and a 36R load to the output of the rail driver. I kept the nominal 74.8dB voltage divider at the output as before and conducted the same set of tests. (Output of rail driver connected to the input of the preamp. Preamp to sound card.) The measured output from the voltage divider was within about one dB from 50Hz to 90kHz and the ripple stimulus remained at 1V throughout.
I'm running out of ideas on how to look for a 20dB per decade roll-off. The sound card is flat. The preamp and sound card are, together, flat. The rail driver has no problem providing the requisite 1Vpp stimulus across all frequencies of interest when loaded with a 470nF cap and 0.5A is more than enough to discharge the cap with sufficient slew rate. When the voltage regulator is replaced with a simple flat attenuator the output reads flat.
Other ideas?
(I made one change to the preamp when auditing values: I replaced R215 with a new resistor as the existing one was reading a bit low.)
(I made one change to the preamp when auditing values: I replaced R215 with a new resistor as the existing one was reading a bit low.)
Maybe that resistor was the issue...
I decided, having exhausted all permutations I could think of, to test the discrete regulator circuit again. (I will post the schematic and screen shots from ARTA tomorrow. It's late here.) I also made better attempts to ground the enclosure of the preamp to the exterior enclosure which housed the rail driver, voltage reg DUT and preamp box.
For the observations below with stimulus frequencies below 50kHz it was a bit like waiting for something to appear from the noise fog as a result of 32 averaging. Nonetheless this is what I got:
192kHz FFT=65536 Window=Hanning 1Vpp stimulus (-9dBV)
Hz dBV/rtHz
50 -136.7
100 -138.5
200 -140.7
500 -140.0
1k -139.9
2k -138.4
5k -135.7
6k -135.3
7k -135.1
8k -134.5
9k -134.2
10k -135.3
20k -132.5
50k -118.4
60k -115.9
70k -113.0
80k -112.1
90k -109.3
A bit more sensible with respect to the expected roll-off in PSRR.
I will do the test again tomorrow as well as check the preamp gain once more. For these tests I had entered a preamp gain of 794x into ARTA.
Last edited:
Well fingers crossed these results are more sensible...
At one point I measured R215 (in circuit) closer to 80k.
(Obviously in terms of PSRR dB the numbers above need to be adjusted by 9dB to reflect the fact that the ripple wasn't 0dBV)
Mark will no doubt suggest I revisit testing the LM317...
At one point I measured R215 (in circuit) closer to 80k.
(Obviously in terms of PSRR dB the numbers above need to be adjusted by 9dB to reflect the fact that the ripple wasn't 0dBV)
Mark will no doubt suggest I revisit testing the LM317...
- Status
- Not open for further replies.
- Home
- Amplifiers
- Power Supplies
- Measuring PSRR