Thanks!
Good to hear that this is of some general interest. 🙂
I did do off axis in the workshp as well, but I'll return to that when I'm reasonably comfortable with the low-frequency results, which will mainly be used for base lining baffle-step corrections.
And to clarify, there's no crossovers involved yet, so far I've only measured the raw response of the Woofer as assembled in the box. The plan is to use an active set-up. i.e electronic X-over & correction and separate amps.
My hope is that I can deal with the X-over frequency home due to the higher frequencies, as it would be a right pain to keep setting up at work all the time!
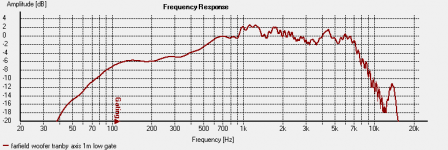
From what I can judge, the increased distance to surface (2,3m approx) made it possible to get a plot that extends down to 2-300 Hz without too much ripple or garbage.
This seems to be sufficient to identify the baffle step+ driver response, and it seems that I have a drop of 6-7 dB from just under 1k down to 250 Hz.
Below is a plot showing 1m on axis measured in the workshop, where I have increased the gating time until I got a clear "low-frequency shelf" giving me some confidence regarding the start and end of the baffle step roll-off.
Assuming for the time being that this is a valid measurement (those of greater knowledge might yet again step in and correct me here!), I hope to use this for calculating a baffle step compensation slope. The actual level of baffle step is something I intend to establish by measuring actual room response with the speakers placed as they will be used.
As for distortion measurements, The original SEAS data-sheets have this, and I don't really expect this to be too different in my design. Besides, I only have a 50 dB measurement range with my set up at home. In the workshop this dropped to 30 dB due to background noise from machines and ventilation.
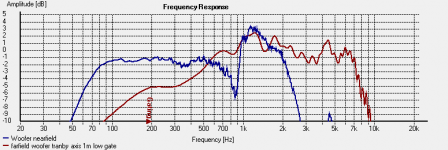
Finally, I think it is interesting to compare this with the original SEAS data-sheet plot, there seems to be a correlation.
Good to hear that this is of some general interest. 🙂
I did do off axis in the workshp as well, but I'll return to that when I'm reasonably comfortable with the low-frequency results, which will mainly be used for base lining baffle-step corrections.
And to clarify, there's no crossovers involved yet, so far I've only measured the raw response of the Woofer as assembled in the box. The plan is to use an active set-up. i.e electronic X-over & correction and separate amps.
My hope is that I can deal with the X-over frequency home due to the higher frequencies, as it would be a right pain to keep setting up at work all the time!
From what I can judge, the increased distance to surface (2,3m approx) made it possible to get a plot that extends down to 2-300 Hz without too much ripple or garbage.
This seems to be sufficient to identify the baffle step+ driver response, and it seems that I have a drop of 6-7 dB from just under 1k down to 250 Hz.
Below is a plot showing 1m on axis measured in the workshop, where I have increased the gating time until I got a clear "low-frequency shelf" giving me some confidence regarding the start and end of the baffle step roll-off.
Assuming for the time being that this is a valid measurement (those of greater knowledge might yet again step in and correct me here!), I hope to use this for calculating a baffle step compensation slope. The actual level of baffle step is something I intend to establish by measuring actual room response with the speakers placed as they will be used.
As for distortion measurements, The original SEAS data-sheets have this, and I don't really expect this to be too different in my design. Besides, I only have a 50 dB measurement range with my set up at home. In the workshop this dropped to 30 dB due to background noise from machines and ventilation.
Finally, I think it is interesting to compare this with the original SEAS data-sheet plot, there seems to be a correlation.
Attachments
Last edited:
Great. 2m equals a 11.6ms (2m+2m) reflection free impuls resonse and a lower limit of 1/0.0116s ≈ 90Hz.
Best, Markus
Since this is an educational thread, can some comment on how you determine the proper gating based on the distance to the nearest reflection? And how that gating window determines the lower limit of the freq. response measurement?
Frequency, Wavelength, Time and Distance Calculator That will help you set the gate.
The lowest frequency of usable response (1/gate time).
You can also remember that sound has to hit something and then bounce back to screw up the measurement, so distance=(time*speed)/2 for max gate w/o reflection, but you don't need to go that long, but it will help you measure a bit lower. Just know the distance of your nearest reflection.
That should get you started.
Dan
Dantheman,
Thank you for your clarification and for throwing in the link to the wavelength calculator!🙂
These are not difficult things to calculate "manually", but we are all lazy and love simple to use calculators and software! 😀
Anyway, this shows that the measurement distances I used in the workshop should correspond to a lower frequency of 143 Hz. This is a conservative figure as it doesn't take in to account the "detour" a bounced reflection makes.
To me, this correlates rather well with the gate point in the last measurement plot I posted.
Great work so far Elbert. You inspired me to drag my testing equipment to work as well 🙂
My company is 24/7, so although there are much larger locations for testing. I just can't rely on a low noise floor. I've been forced into the QA lab 🙁. Which still provides me with ~2m in all directions, but it's a tight squeeze.
So do you consider the efforts well spent...?
My company is 24/7, so although there are much larger locations for testing. I just can't rely on a low noise floor. I've been forced into the QA lab 🙁. Which still provides me with ~2m in all directions, but it's a tight squeeze.
So do you consider the efforts well spent...?
Again, great thread.
Just to clarify in regards to gate time and lowest freq. that can be measured.
If the nearest reflection is 1.5 m, the sound has to go from the speaker to the reflection, then to the microphone, so it travels approx. 3.0 m (assuming the reflection is equidistant from both).
3 meters / 345 meters/sec = 0.00869 sec (8.69 mSec) -> you need a gate faster (smaller) this 8.69 mSec.
For the lowest freq. → 345 meters/sec / 1.5 meters = 230 1/sec (Hz). Any freq. smaller then 230 Hz has a wavelength that is larger then 1.5 meter and therefore "fills" the distance between the speaker and the reflection point.
Smokinghot, glad to hear you found some inspiration from this!
I hope you find the effort as worthwhile as I did. After making those measurements in the workshop, I now feel that I have a usable picture of the LF/ baffle step performance.
To me, it became quite obvious that the home-measurements left me with an "information gap" between the near field measurement and the gated far field measurement.
I hope the curves I posted can visualize this.
Again, thanks for substantiating this thread further stingray! The theoretical values for establishing the gating point is of course helpful, but I found it very useful to move the gating point around a bit to see where the integrity of the measurement curve would actually degrade significantly. At least in the instance of my set-up, there were obviously some smaller sources of closer reflections meaning I wouldn't feel entirely confident with just setting the gate point at a theoretically correct setting.
Ostensibly, the benefits of measuring reflection-free at 2m vs. 1m are 1) better integration between the drivers, and 2) resolution of frequencies an octave lower. Did those occur, and was it sufficiently worth the effort to warrant doing this routinely?
What is your acoustic crossover frequency, that we may discern the driver integration element in the results?
The difference should be more obvious if we could have a look at polar maps from different mike distances.
Best, Markus
Again, great thread.
Just to clarify in regards to gate time and lowest freq. that can be measured.
If the nearest reflection is 1.5 m, the sound has to go from the speaker to the reflection, then to the microphone, so it travels approx. 3.0 m (assuming the reflection is equidistant from both).
3 meters / 345 meters/sec = 0.00869 sec (8.69 mSec) -> you need a gate faster (smaller) this 8.69 mSec.
For the lowest freq. → 345 meters/sec / 1.5 meters = 230 1/sec (Hz). Any freq. smaller then 230 Hz has a wavelength that is larger then 1.5 meter and therefore "fills" the distance between the speaker and the reflection point.
for a gate of 8.69msec, your lowest point would be 112Hz. Some would consider that data point less than accurate. lowest F=1/gate So your 230 would agree better with some people--different types of gating affect LF differently.........I actually like it better, but I really haven't getting any deeper the 200Hz all that useful. Your room will dominate it.
For the 201 course, figure out how the different types of gating operate.😕
Hopefully I Haven't misled you at all, but this is how I understand it. I am new to this and just an amateur.
Dan
Guys, you don't have to get all hung up on the gating time and frequency etc, if you use HolmImpulse because it keeps track of all of that for you. Just look at the impulse and adjust the window to eliminate the first reflection and the software will show you were this is on the frequency chart.
Elbert
Well done. Just keep playing whether you think the data is any good or not. It gives you experience using the tools.
I played with my set up for a week before I had any faith in my measurements. Play "what if I try this..." and see what happens. Worst you can be is wrong.
Mike
Well done. Just keep playing whether you think the data is any good or not. It gives you experience using the tools.
I played with my set up for a week before I had any faith in my measurements. Play "what if I try this..." and see what happens. Worst you can be is wrong.
Mike
learning my way around
Thats good to hear, I've got 2 weekends in measuring 4 different speaker types playing around and I don't trust my results yet, I have been using a Radio Shack SPL meter, seems to drop off past 10k no matter what speaker I measure, I think I am going to order a Dayton EMM-6. Should have it by next weekend.
Elbert
Well done. Just keep playing whether you think the data is any good or not. It gives you experience using the tools.
I played with my set up for a week before I had any faith in my measurements. Play "what if I try this..." and see what happens. Worst you can be is wrong.
Mike
Thats good to hear, I've got 2 weekends in measuring 4 different speaker types playing around and I don't trust my results yet, I have been using a Radio Shack SPL meter, seems to drop off past 10k no matter what speaker I measure, I think I am going to order a Dayton EMM-6. Should have it by next weekend.
Forget the Radio Shack SPL meters for measurements:
(From Comparison of ten room testing microphones)
Some tips:
- Make sure all levels are set correctly. An overdriven input will make the measured frequency response look misleadingly flat.
- Measure the noise floor and adjust your measurement signal accordingly. The noise floor can be pretty high in domestic environments.
- If possible get a calibration file (that's a simple text file) for your mike that allows you to correct deviations in its frequency response,e.g.
Best, Markus
(From Comparison of ten room testing microphones)
Some tips:
- Make sure all levels are set correctly. An overdriven input will make the measured frequency response look misleadingly flat.
- Measure the noise floor and adjust your measurement signal accordingly. The noise floor can be pretty high in domestic environments.
- If possible get a calibration file (that's a simple text file) for your mike that allows you to correct deviations in its frequency response,e.g.
An externally hosted image should be here but it was not working when we last tested it.
Best, Markus
Last edited:
I am seeing that, it was just there so I tried it. I am seeing the same bump at 5-7K and drop like a rock after 10K that you show.Forget the Radio Shack SPL meters for measurements:
I'm gonna order a better measurement micSome tips:
- Make sure all levels are set correctly. An overdriven input will make the measured frequency response look misleadingly flat.
- Measure the noise floor and adjust your measurement signal accordingly. The noise floor can be pretty high in domestic environments.
- If possible get a calibration file (that's a simple text file) for your mike that allows you to correct deviations in its frequency response,e.g.
any tips on measuring the noise floor?
Measure without the speaker plugged in, or with it muted, or whatever you can accomplish in your setup so you're measuring silence (which is not really silent). I have seen variations in my noise floor before due to the furnace running, the refrigerator running, etc.
I'm gonna order a better measurement mic
any tips on measuring the noise floor?
The Berhringer is a good deal. It compares well to my Earthworks.
Guys, you don't have to get all hung up on the gating time and frequency etc, if you use HolmImpulse because it keeps track of all of that for you. Just look at the impulse and adjust the window to eliminate the first reflection and the software will show you were this is on the frequency chart.
Understood Earl.
I do think it is important for people to understand some of the math/theory behind what HolmImpulse is doing. It makes it a lot easier when it is late and something is not working land no one is on the forum. If there is a basic understanding, some issues can be figured out on their own.
Understand the concepts - leave the details to the programmer.
Hooray! Lots of fresh input! 🙂
I think Dr. Geddes has some good pragmatic points here, good to have someone drag the thread back down to ground!
Regarding measurement mic, I think the availablilty of a calibration file, gneric or unique is a good thing to watch out for, especially for the cheaper alternatives as these tend to be less linear than the pro stuff. That's why I chose to build my Panasonic WM-61 based there was a calibration file ready and waiting to be plugged in!
I agree that it's a very good idea to play around and get a feel for how different things influence the results, that has certainly made me feel a lot more confident so far!
In addition, it turns out that I'm quite fortunate here. The original factory plot from SEAS was taken using a closed measurement box about the same volume as mine, but not only that: the baffle dimensions were almost the same too! The biggest difference was the placement of the woofer, the SEAS measurement box has the woofer center line about 10 cm from the short edge whilst mine is placed approx. 14 cm in.
That should make the SEAS plot quite valuable as a reference, not only for me, but also for this thread.
Now, I have some measurements for which I feel reasonably comfortable, perhaps time to start pulling things together a bit?
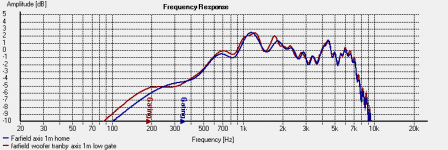
With an eye towards future x-over work and respnse shaping, which I hope to be doing in the relative comfort of my living room, I thought it would be a good idea to gauge a farfield measurement doen in my living room with the "farther" field measurement I did at the workshop.
I superimposed the two, and adjusted the gate-time for the home measurement until the plot matched best with the workshop measurement.
This should allow for some consistency further on .. I hope.. 🙂
This is what it looks like, the red curve is obviously the one from the workshop as it has the better LF extension.
I think Dr. Geddes has some good pragmatic points here, good to have someone drag the thread back down to ground!
Regarding measurement mic, I think the availablilty of a calibration file, gneric or unique is a good thing to watch out for, especially for the cheaper alternatives as these tend to be less linear than the pro stuff. That's why I chose to build my Panasonic WM-61 based there was a calibration file ready and waiting to be plugged in!
I agree that it's a very good idea to play around and get a feel for how different things influence the results, that has certainly made me feel a lot more confident so far!
In addition, it turns out that I'm quite fortunate here. The original factory plot from SEAS was taken using a closed measurement box about the same volume as mine, but not only that: the baffle dimensions were almost the same too! The biggest difference was the placement of the woofer, the SEAS measurement box has the woofer center line about 10 cm from the short edge whilst mine is placed approx. 14 cm in.
That should make the SEAS plot quite valuable as a reference, not only for me, but also for this thread.
Now, I have some measurements for which I feel reasonably comfortable, perhaps time to start pulling things together a bit?
With an eye towards future x-over work and respnse shaping, which I hope to be doing in the relative comfort of my living room, I thought it would be a good idea to gauge a farfield measurement doen in my living room with the "farther" field measurement I did at the workshop.
I superimposed the two, and adjusted the gate-time for the home measurement until the plot matched best with the workshop measurement.
This should allow for some consistency further on .. I hope.. 🙂
This is what it looks like, the red curve is obviously the one from the workshop as it has the better LF extension.
Attachments
- Status
- Not open for further replies.
- Home
- Loudspeakers
- Multi-Way
- Measurement approach, 2-way closed box