Yes they are indeed. Years ago I got quite a few and sold them to F3 enthusiasts, retaining about a dozen.
The drain current of the two graphs differ by a factor of 10 ?
Patrick
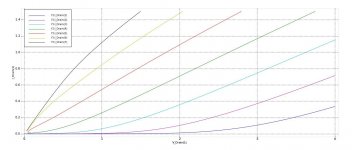
Yes. The first curve is intended to have a look at how the device is used in the F3.
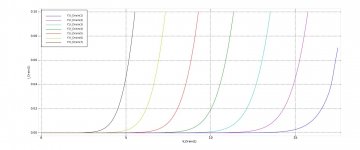
The second curve is intended to look at using the device at lower current and higher voltage.
Would you be kind enough to do one of the second also for the F3 current range ?
Curve taken at room temperature, in pulse mode, without heat sinking ?
Patrick
Curve taken at room temperature, in pulse mode, without heat sinking ?
Patrick
Would you be kind enough to do one of the second also for the F3 current range ?
Curve taken at room temperature, in pulse mode, without heat sinking ?
Patrick
Will do. I have to reconfigure the equipment stack for that.
For the moment, what I am doing to fake out pulse mode is to make NPLC small. I have gone down to 0.05 NPLC which is 834 uS. Reducing points on the curve also reduces total energy. If I end up writing my own software some day, I will have a place to limit total energy per unit of time; duty cycle if you will, to approach isothermal.
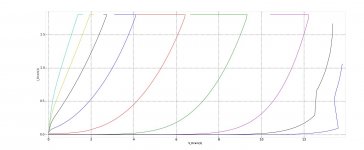
Vgs -2.3v to -1.1v in 8 equal steps. The wonky shaped curves are an interaction of the sourcemeter with the device. I tried about 20 different things none of which cured the problem. I will re-visit when I can.
Current limit was set at 1.8A
Current limit was set at 1.8A
Attachments
I disconnected the computer and investigated using the front panel of the instruments.
The drain current is quite unstable when watts are being dissipated. I think that bolting this beast to a heatsink may produce better curves at greater than 10V and above 100 mA.
The drain current is quite unstable when watts are being dissipated. I think that bolting this beast to a heatsink may produce better curves at greater than 10V and above 100 mA.
You need to mount it to a big block of aluminium.
Patrick
Will do. It will be a a few days before I can do that.
- Home
- Amplifiers
- Pass Labs
- LU1014D curve traces