try bss135 model instead.it's very similar and you don't need to simulate the thermal pad.you just take care of the max heat dissipation .besides i verified its simulations below and over the Miller plateau and the measurements are very close to bss135.Actually the measurements for bsp135 in real life circuits were a little bit better than bss135 simulation results as the thermal pad does a good job.
Last edited:
See lib.zip from
For LTspice users. Libraries of models, examples, etc
n_channel_small_signal_L0.asy and
n_channel_small_signal_240V_250V_400V_600V_L0.lib
For LTspice users. Libraries of models, examples, etc
n_channel_small_signal_L0.asy and
n_channel_small_signal_240V_250V_400V_600V_L0.lib
Pawel,
BTW this is a depletion MOSFET not a JFET hence a VDMOS model
*VDMOS with subthreshold (c) Ian Hegglun
.model BSP135J VDMOS (Rg=5 Vto=-0.90 Kp=0.5 Lambda=0m
+ Rs=3.5 Ksubthres=0.1 Mtriode=0.8 Rd=40
+ Bex=-1.9 Vtotc=-0.8m Tksubthres1=1m Trs1=3m Trd1=3m
+ Cgdmax=200p Cgdmin=3p a=0.7 Cgs=60p Cjo=150p m=0.75 VJ=0.75
+ IS=10p N=1.2 Eg=1.12 Rb=1 Vds=600 Ron=60 mfg=InfIH2008)


Choose the Vto to suit the rank marking. The model above is for middle of the "J". And "N" would be -1.65V.
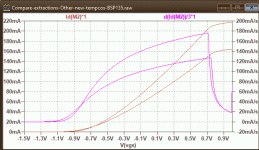
Also the gm for the above model is the top end of the datasheet range (160mA/V at 100mA). For middle of the range use Kp=0.38 and bottom Kp=0.25.
Unfortunately no temp-co plots in my datasheet so I guesed likely temp-co's (see my model plot above for 25C and 75C with Vds=10V).
BTW this is a depletion MOSFET not a JFET hence a VDMOS model
*VDMOS with subthreshold (c) Ian Hegglun
.model BSP135J VDMOS (Rg=5 Vto=-0.90 Kp=0.5 Lambda=0m
+ Rs=3.5 Ksubthres=0.1 Mtriode=0.8 Rd=40
+ Bex=-1.9 Vtotc=-0.8m Tksubthres1=1m Trs1=3m Trd1=3m
+ Cgdmax=200p Cgdmin=3p a=0.7 Cgs=60p Cjo=150p m=0.75 VJ=0.75
+ IS=10p N=1.2 Eg=1.12 Rb=1 Vds=600 Ron=60 mfg=InfIH2008)
Choose the Vto to suit the rank marking. The model above is for middle of the "J". And "N" would be -1.65V.
Also the gm for the above model is the top end of the datasheet range (160mA/V at 100mA). For middle of the range use Kp=0.38 and bottom Kp=0.25.
Unfortunately no temp-co plots in my datasheet so I guesed likely temp-co's (see my model plot above for 25C and 75C with Vds=10V).
Attachments

Hi Alexander,
There is a variation in threshold voltages which you change the Vto value to suit the ranking that you receive J to N.
There is also a variation in manufacture for the gm or transconductance, measured at say 100mA and the datasheet gives the range as 80mS to 160mS.
You can change the model Kp value to suit your simulation need. If you want the middle of this range for the "average part" then use Kp=0.38 rather than Kp=0.5 that I supplied.
- Home
- Design & Build
- Software Tools
- LtSpice model for BSP135