Hey All,
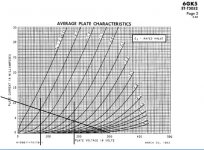
This may be painfully obvious to most tech heads here but its kinda cool, (I think so.) and might be helpful to others. Rather than photocopy a load line graph and use a ruler and pencil, use paint. Its that usually overlooked drawing program in Windows accessories. Do an image search for a loadline graph. My example is a 6GK5. Save it as an image file. Then you can draw as many lines as you like. Screw up? Just exit the file and open your original and start over. No more wearing out erasers on your pencils.
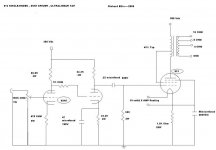
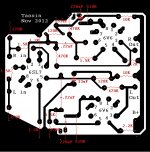
Also, if you find an image of a schematic, download it and save as an image file. Then you can edit it and redesign it as much as you like. You can cut and paste symbols for valves and parts from other schematics.
I'm sure there is some kind of CAD program out there that does this, probably even better. But this is FREE! I hope this helps.
This may be painfully obvious to most tech heads here but its kinda cool, (I think so.) and might be helpful to others. Rather than photocopy a load line graph and use a ruler and pencil, use paint. Its that usually overlooked drawing program in Windows accessories. Do an image search for a loadline graph. My example is a 6GK5. Save it as an image file. Then you can draw as many lines as you like. Screw up? Just exit the file and open your original and start over. No more wearing out erasers on your pencils.
Also, if you find an image of a schematic, download it and save as an image file. Then you can edit it and redesign it as much as you like. You can cut and paste symbols for valves and parts from other schematics.
I'm sure there is some kind of CAD program out there that does this, probably even better. But this is FREE! I hope this helps.
Attachments
Drawings
I use it all the time! Perhaps it is a little slower than other programs with "preset" symbols and such but I can crank out a drawing just fine when words just won't do.
________________________________________________________Rick.......
I use it all the time! Perhaps it is a little slower than other programs with "preset" symbols and such but I can crank out a drawing just fine when words just won't do.
________________________________________________________Rick.......
Attachments
Yes, I use Paint for doing simple drawing. The nice thing about it is that it is so crude that it never tries to second-guess what I am trying to do. I hate smart software! (Especially Microsoft smart software). I have used proper drawing programs (such as Autocad) and find that only the really expensive ones (which I can't afford for home use) are any good; cheaper ones are always buggy.
One snag I have found: as usual for MS, different versions have different parameters/defaults. For a long time I was using an old Win Me laptop. When moving to XP I found that Paint used a different assumption about pixels per inch. Somewhere deep in the psyche of Microsoft there is an irrational fear of version compatibility - it could even be that it is company policy to deliberately annoy their users every few years.
One snag I have found: as usual for MS, different versions have different parameters/defaults. For a long time I was using an old Win Me laptop. When moving to XP I found that Paint used a different assumption about pixels per inch. Somewhere deep in the psyche of Microsoft there is an irrational fear of version compatibility - it could even be that it is company policy to deliberately annoy their users every few years.
I use the GIMP (I run Linux) for that.
I also find it helpful to color code the various loadlines. Red for the DC loadline, blue for AC loadlines where there is enough difference to make a difference, and green for determining gm and u-factor.
An externally hosted image should be here but it was not working when we last tested it.
I also find it helpful to color code the various loadlines. Red for the DC loadline, blue for AC loadlines where there is enough difference to make a difference, and green for determining gm and u-factor.
I just use the Drawing Canvas in MS WORD - as WORD is where I put all my design info so don't have to change application whilst juggling words and loadlines, and I can copy and paste the canvas' in to other Word docs for different amps. I just grab and crop the appropriate graph from the datasheet (either save the pdf as a tiff in Acrobat, and then use paint to change to gif - or do a screengrab in to paint).
I use the drawing programme in Open Office within Linux. It is all freeware and not lining Gates' pocket!
This free service can be used to convert pdf files to many different formats:
Zamzar - convert document, eBook, image, audio and video - free online file conversion
Zamzar - convert document, eBook, image, audio and video - free online file conversion
I use paint too. I've got a windows tablet and can use a ruler and pen right on the screen.. it's great!
I've only been playing with (free) GeoGebra for a few days but it looks good for this
GeoGebra
requires Java - you did update to the 7 security fix release, remove old versions - right?
GeoGebra is a plane geometry tool but can also import, manipulate graphics
you can set object colors, transparancy to layer your added eyball fit lines, axis projection, quadratics on top of the datasheet graphic
if you scale, rotate imported load line graphics object to the drawing reference axis your added points, lines, coordinates, conics equations show in a sidebar, update "live" as you drag the points, or add slider buttons for formula defintions that get drawn "live" - and would be easily translated to electrical units
Tutorial:Transformations & Inserting Pictures into the Graphics View - GeoGebraWiki
Last edited:
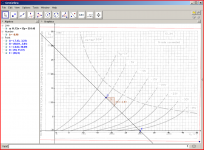
Snip Tool capture of tube datasheet pdf output charateristic graph as png (or gif, jpg...)
import to Geogebra, add control points, adjust transparancy, drag control points to allign graph axis with Geogebra's axis, even line up with "nice" scale factor of 10x
(control points being corners of graphic its a bit fiddly but adjustments converge quickly - but also works when the plot isn't lined up with the pdf page/snip edges)
zoom axis more 1st and could resize graphic to 1:1 V, mA scale factors
then put 2 points on graph, line thru points - display slope, numeric result
alternatively could have placed point at supply V, speced slope from resistor Ohm value.. ..diddle slope 'til you like looks of load line
has easy to add slider controls for point coordinates, slopes...
could draw parallels to load line, put points on grid V intersections, fit parabola...
Attachments
Last edited:

- Home
- Amplifiers
- Tubes / Valves
- Loadlines and Microsoft Paint