VituixCAD can do that. It just needs the horizontal and vertical measurements.Are there tools to generate cea2034 graphs from separate measurements? If e.g. REW could do that it would be nice.
I can quite easily generate and export data. If I don't have to do the calculations, that saves me some time and effort.
https://www.audiosciencereview.com/...ct-spinorama-cea2034-from-the-nfs-data.14141/
???
https://www.audiosciencereview.com/...s/20211124-octave-matlab-ppr-v1-0-zip.167722/
This appears to be the latest and most worked out version.
???
https://www.audiosciencereview.com/...s/20211124-octave-matlab-ppr-v1-0-zip.167722/
This appears to be the latest and most worked out version.
Last edited:
Tom, searching reading and absorbing is what I do daily. I can usually find things. Except for a few times. Like the original Thesis paper that Klippel based their system on. It is buried. Myself along with the truly smart people ( I'm not anywhere near these guys in my maths proficiency ) on the Audio Science thread tried for a few months to find that original paper. It is scrubbed off of the internet. But we did find a few alternate methods of doing the same thing by students that were not disciples of Herr Klippel. And those were available.
Last edited:
This has I think all the graphs a person would wish to have.You found it!
The spherical harmonics are always real, however each term in the series will be complex owing to the Hankel functions, which are always complex. The fitted coefficients would be complex in the most general case, but maybe real will work?. I investigated this and found that using complex coefficients made the HFs better fit the experimental data. At LFs there was little difference. Low frequencies have few modes in the sum (only one or two in many cases, with one often dominate) so their sensitivity to real versus complex would be much lower.I might have been using the wrong spherical harmonics (complex vs. real). It needs more investigation.
Last edited:
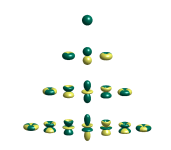
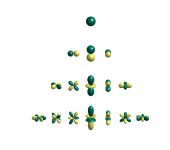
The left one is enshrined in the right one making it kind of redundant to add colors. The value of the function is simply how far that point is from the origin (r), and that's apparent from the right hand picture. This confused me when I first saw it (why two?), but then I figured out what I stated above.Here is a recreation of the image of spherical harmonics on wikipedia (colors: left the value, right the sign only):
View attachment 1467201View attachment 1467205
Do you mean the Weinreich paper? I have a copy. Somewhere.... for a few months to find that original paper. It is scrubbed off of the internet. But we did find a few alternate methods of doing the same thing by students that were not disciples of Herr Klippel. And those were available.
The spherical harmonics are always real, however each term in the series will be complex owing to the Hankel functions, which are always complex. The fitted coefficients would be complex in the most general case, but maybe real will work?. I investigated this and found that using complex coefficients made the HFs better fit the experimental data. At LFs there was little difference. Low frequencies have few modes in the sum (only one or two in many cases, with one often dominate) so their sensitivity to real versus complex would be much lower.
Complex:

Real:

https://docs.abinit.org/theory/spherical_harmonics/
As I have a lot to do, I'm not trying to fully understand every little detail. Others have identified the real spherical functions to be a good function set. For the processing, it's simply fitting. I expected them to look like in the Klippel docs/papers, but I found mine looked like the complex spherical functions, so I switched to real spherical functions.
I'm using complex coefficients, because that is what I get from the fit.
I could use some better measurements to improve the processing. For that I need to get it up and running again after my switch to wireless motion control.
Update:
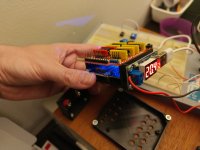
I'm designing and printing a support structure where all motion control electronics are mounted to. Everything (20V for servo, 5V usb for processing board) is powered from 20V and converted to 5V by the little board with the voltage display. Work in progress, which I plan to document along the way so others can build it too in the (near?) future.

- Home
- Design & Build
- Software Tools
- Klippel Near Field Scanner on a Shoestring
