Reducing very low frequency system noise (<< 20 Hz) by only a couple or few dB reduces a layer of intermod that intrudes over everything in the band of interest (20-20k).
Dan.
I thank you for these lines. The truth in simple words.
I will try to add to the understanding with an example.
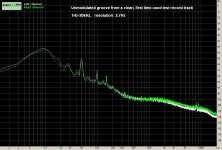
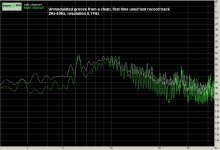
Here is the 1Hz-20kHz spectrum from a cartridge reading an unmodulated test track from a brand new test record, first in low resolution and then in high resolution.
[url]http://www.diyaudio.com/forums/attachment.php?attachmentid=380373&stc=1&d=1383491245[/URL]
[url]http://www.diyaudio.com/forums/attachment.php?attachmentid=380374&stc=1&d=1383491245[/URL]
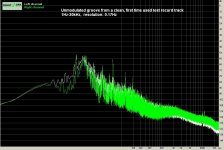
Now zoom in at the 2Hz-40Hz range in high resolution.
http://www.diyaudio.com/forums/attachment.php?attachmentid=380375&stc=1&d=1383491245
You see a waviness (which continues all the way to 20kHz), the frequency of which is 0.55Hz due to 33.3rpm record rotation velocity.
You see the peak at 6.2Hz due to motor rotation velocity (belt drive).
You see a hump at 8 to 11Hz due to arm-cartridge resonance.
You see an imbalance between the spectrum of the two channels caused by minor asymmetric scratch-dirt on the grooves.
All these from a clean –almost scratch free-unmodulated groove.
What if some strong modulation is present?
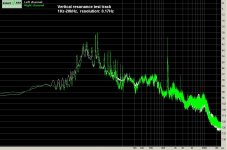
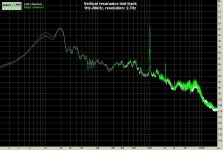
Here is the 1Hz-20kHz spectrum from a cartridge reading the vertical resonance test track from this test record, first in low resolution and then in high resolution.
http://www.diyaudio.com/forums/attachment.php?attachmentid=380376&stc=1&d=1383491245
http://www.diyaudio.com/forums/attachment.php?attachmentid=380377&stc=1&d=1383491245
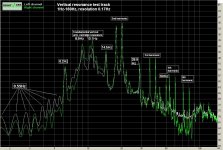
Now zoom in at the 1Hz-160Hz range in high resolution.
http://www.diyaudio.com/forums/attachment.php?attachmentid=380378&stc=1&d=1383491245
You see the 0.55Hz wrap, the 6.2 Hz motor, the double fundamental vertical resonance and it’s harmonics.
You see the second harmonic stronger than the fundamental and you wonder why. There are also some other single peaks. All these have to do with the components of horizontal resonance mode and their phase relation with some components of the vertical resonance.
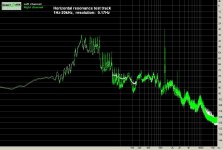
(below horizontal resonance spectrum, first in low resolution,then in high resolution plus zoom in) http://www.diyaudio.com/forums/attachment.php?attachmentid=380379&stc=1&d=1383491245
http://www.diyaudio.com/forums/attachment.php?attachmentid=380380&stc=1&d=1383491245
http://www.diyaudio.com/forums/attachment.php?attachmentid=380381&stc=1&d=1383491245
All of the mechanical components imprint their signatures on the electrical waveform of the cartridge. Pitch change, freq modulation, amplitude modulation, vibrato, tremolo are all there across the complete freq spectrum.
HP electric filtering -passive or active- right at the preamp input will not change this but it will reduce the additional repeating of this modulation process at the amplifying stages –which may be significant-and will protect from LF overload.
DSP processing by convoluting the cartridge signal with the impulse response of the complete mechanical system would provide a cure but this impulse response is strongly amplitude dependant, so there is no straight DSP cure either.
I am convinced that the "gloom, full, bodied ect. sound" of the LP reproduction is because all these effects -and some more-are interacting with various parameters in the psychoacoustic domain.
George
Edit> PS I see Scott wrote something similar above while I was posting
Attachments
-
 1 Unmodul test track low res 1Hz-20kHz.JPG131 KB · Views: 401
 -
 9 Horizontal Resonance high res 2Hz-40Hz.JPG102.9 KB · Views: 119
 -
 8 Horizontal Resonance high res 1Hz-20kHz.JPG119.9 KB · Views: 134
 -
 7 Horizontal Resonance low res 1Hz-20kHz.JPG129.6 KB · Views: 132
 -
 6 Vertical Resonance high res 1Hz-160Hz.JPG145.4 KB · Views: 161
 -
 5 Vertical Resonance high res 1Hz-20kHz.JPG119.9 KB · Views: 391
 -
 4 Vertical Resonance low res 1Hz-20kHz.JPG130.9 KB · Views: 392
 -
 3 Unmodul test track high res 2Hz-40Hz.JPG124.7 KB · Views: 399
 -
 2 Unmodul test track high res 1Hz-20kHz.JPG123.5 KB · Views: 384
Last edited:
Sub 20Hz .....
Somehow there's something wrong with active filtering?
It was determined (?) to be the affects of group-delay when HP filtering was used. Combined HP filtering in the cutter electronics with the desire to increase playing time (more HP filtering) and the justification that few speakers went below 40Hz - 60hz - then add the preamp HP filter and you have a mess for sound which intrudes well into the audible range.
If I was still tied, unfortunately, to LP listening... and had to deal with the above Plus tone-arm/cartridge resonances... I would probably use a switchable (in-out) HP filter even if I could hear its affects...... but what cut-off rate?
Thx-RNMarsh
Last edited:
I am convinced that the "gloom, full, bodied ect. sound" of the LP reproduction is because all these effects -and some more-are interacting with various parameters in the psychoacoustic domain.
George
Thank you George for showing us how intertwined the system effects are. The >1/2% THD @ 1kHz is just an added feature. I have plenty of LP's that I just love in spite of all this.
I especially love the sixth plot, do you think the cart is actually moving in a little helix a different frequency in each axis? Aren't your "verticle" and "horizontal" in this context the modulation of the 1kHz tone? I have an entire RCA STR series test record recorded to digital somewhere, I should dig it out and do the same thing now that I can do megapoint FFT's on it.
EDIT - Maybe a description of exactly what the test tracks were would clarify.
Last edited:
It was determined (?) to be the affects of group-delay when HP filtering was used.
Thx-RNMarsh
You mean the Bybee's have no group delay too! This is easy in the digital domain with back and forth IIR filters but then you have essentially 100% precognition.
This is easy in the digital domain with back and forth IIR filters but then you have essentially 100% precognition.
You forget that quantum effects also allow post-cognition.
😎
Yes very much so , good work George. interesting to see how much of this is repeatable from cartridge to cartridge and how much is arm articulation...
George,
When you have a resonance the energy will continue to build as long as the stimulus is present. So depending on your measurement method a resonant source may show more energy that the exciting source.
In room acoustics I have seen this as a 3 dB rise above the source level. In a mechanical aluminum resonance 20 dB or more has shown up.
Beautiful job, George! It's certainly striking to see how big the once-per-revolution artifacts really get. Nakamichi once made an expensive turntable that automatically nudged the record around on the platter, before playing, to (mostly) correct this (eccentricity) at the source. Looks like some manual effort along that line might be worthwhile when making an archival transfer to digital.
Thanks very much, as always,
Chris
Thanks very much, as always,
Chris
Thank you Scott, SY, Bruce, Ed, Chris for your kind words.
Don’t think that I am that queer. I have caught a good cold, my head is heavy and I can not do anything productive apart from sitting in front of the pc and chewing some old measurements.😀
Normally, I too have my technical side and my musical side kept separated for to enjoy the pleasure that each one gives me but I don’t succeed always.
Three days ago, I spinned an old LP, Chick Corea-return to forever (ECM 1022 ST from 1972).
On side two “Sometime ago-la fiesta”, Stan Clarke plays on a double bass. Great moments !
Next day I found in my hard disk a copy of the first cd issue (ECM 422811978-2) of this album ((P)1972, ©1972.
I listened to it and I noticed a drier sound from the bass and more mid frequency details from the stressed chords.
I sat and listened to the lp and cd copy through headphones. I had the same impression as with through the loudspeakers.
I digitized the first 5 minutes of the lp track and I was watching on the pc screen the waveforms from the double bass take. The amplitude on the low notes was the same as from the cd file. The bass was there and intact on the cd but the harmonics of the tortured strings were better defined, so it is probably my mind that focuses on the details and gives less attention on the low notes. Who knows?!
Scott, sorry I don’t understant what you mean here. Can you rephrase it a bit?
Yes.
Correct.
The test record is the HFNews test LP release 2002 (“HFN 002 Test LP”)
The unmodulated groove take is from side two, track 6
“Residual system noise (unmodulated grooves)
Unmodulated grooves which when played at normal listening levels will pick up any noise in your system such as rumbling bearings or poor plinth design.”
The horizontal and vertical resonance takes were from side two, tracks 2 and 3
“Cartridge/Arm Lateral/Vertical resonance test (sweep)
These give a visual indication of the resonant frequency of your arm / cartridge combination. When the cartridge suspension becomes excited there is an obvious 'wobble' of the stylus and the pilot tone warbles. You are aiming for a reading of 8-15Hz and applying tonearm damping can help here if your cartridge is a mismatch for the arm.”
It turns masochistic to do this test with every change but it is a way to get some understanding of what is going on, apart from the listening evaluation.
When I was modyfying the TT and the arm, the sound was going to the stiffer side. I said to a friend of mine : The TT sounds quite close to a CD now”. He said: Undo all the modifications then” 😱
Ed, you are referring to the higher 2nd harmonic, yes?
I reached to that conclusion after much thought.
The two-peak (f1, f2) resonance has to be due to the two mass systems, the one in front of the arm vertical bearing and the other behind the bearing. These two systems vibrate in antiphase, that’s why there is not a peak at the f1+f2 frequency point.
IMO had the effect of increased 2nd harmonic was due to the delayed release of energy, one of the peaks would have to change it’s Q as the mass of the two systems is very different. But I may be wrong and as always, thank you for the help.
Oh, oh. Winter time is coming and there are some hundred precious records waiting for digitisation here. I have to iron out (still) a few issues before starting that already postponed activity
George
Don’t think that I am that queer. I have caught a good cold, my head is heavy and I can not do anything productive apart from sitting in front of the pc and chewing some old measurements.😀
I have plenty of LP's that I just love in spite of all this.
Normally, I too have my technical side and my musical side kept separated for to enjoy the pleasure that each one gives me but I don’t succeed always.
Three days ago, I spinned an old LP, Chick Corea-return to forever (ECM 1022 ST from 1972).
On side two “Sometime ago-la fiesta”, Stan Clarke plays on a double bass. Great moments !
Next day I found in my hard disk a copy of the first cd issue (ECM 422811978-2) of this album ((P)1972, ©1972.
I listened to it and I noticed a drier sound from the bass and more mid frequency details from the stressed chords.
I sat and listened to the lp and cd copy through headphones. I had the same impression as with through the loudspeakers.
I digitized the first 5 minutes of the lp track and I was watching on the pc screen the waveforms from the double bass take. The amplitude on the low notes was the same as from the cd file. The bass was there and intact on the cd but the harmonics of the tortured strings were better defined, so it is probably my mind that focuses on the details and gives less attention on the low notes. Who knows?!
I especially love the sixth plot, do you think the cart is actually moving in a little helix a different frequency in each axis?
Scott, sorry I don’t understant what you mean here. Can you rephrase it a bit?
Aren't your "verticle" and "horizontal" in this context the modulation of the 1kHz tone?
Yes.
EDIT - Maybe a description of exactly what the test tracks were would clarify.
Correct.
The test record is the HFNews test LP release 2002 (“HFN 002 Test LP”)
The unmodulated groove take is from side two, track 6
“Residual system noise (unmodulated grooves)
Unmodulated grooves which when played at normal listening levels will pick up any noise in your system such as rumbling bearings or poor plinth design.”
The horizontal and vertical resonance takes were from side two, tracks 2 and 3
“Cartridge/Arm Lateral/Vertical resonance test (sweep)
These give a visual indication of the resonant frequency of your arm / cartridge combination. When the cartridge suspension becomes excited there is an obvious 'wobble' of the stylus and the pilot tone warbles. You are aiming for a reading of 8-15Hz and applying tonearm damping can help here if your cartridge is a mismatch for the arm.”
Bruce, every change, even small, will show a difference in the spectrum. Tightening the cartridge bolts, changing the record matt, hardening the sub platter suspension ect.interesting to see how much of this is repeatable from cartridge to cartridge and how much is arm articulation...
It turns masochistic to do this test with every change but it is a way to get some understanding of what is going on, apart from the listening evaluation.
When I was modyfying the TT and the arm, the sound was going to the stiffer side. I said to a friend of mine : The TT sounds quite close to a CD now”. He said: Undo all the modifications then” 😱
George,
When you have a resonance the energy will continue to build as long as the stimulus is present. So depending on your measurement method a resonant source may show more energy that the exciting source.
In room acoustics I have seen this as a 3 dB rise above the source level. In a mechanical aluminum resonance 20 dB or more has shown up.
Ed, you are referring to the higher 2nd harmonic, yes?
I reached to that conclusion after much thought.
The two-peak (f1, f2) resonance has to be due to the two mass systems, the one in front of the arm vertical bearing and the other behind the bearing. These two systems vibrate in antiphase, that’s why there is not a peak at the f1+f2 frequency point.
IMO had the effect of increased 2nd harmonic was due to the delayed release of energy, one of the peaks would have to change it’s Q as the mass of the two systems is very different. But I may be wrong and as always, thank you for the help.
Yes Chris very true and as it is of such low frequency, it can (and does) excite all the resonance modes.It's certainly striking to see how big the once-per-revolution artifacts really get.
Chris
when making an archival transfer to digital.
Oh, oh. Winter time is coming and there are some hundred precious records waiting for digitisation here. I have to iron out (still) a few issues before starting that already postponed activity
George
Last edited:
Thank you Scott, SY, Bruce, Ed, Chris for your kind words.
Scott, sorry I don’t understant what you mean here. Can you rephrase it a bit?
What I mean is that you probably could never excite only H or V resonances without some crosstalk. That is the cart is actually going side to side and up and down at the same time on any of these cuts.
I will try to add to the understanding with an example.
Great work, and so refreshing!
Imagine, actual measurements that can be correlated to actual, well-understood mechanical phenomena, and which can also be correlated with system changes and listening results! What will become of the folks who say we can't measure anything useful?
Now stick a Bybee in front of one channel and see if anything "magical" happens! 🙂
The two-peak (f1, f2) resonance has to be due to the two mass systems, the one in front of the arm vertical bearing and the other behind the bearing. These two systems vibrate in antiphase, that’s why there is not a peak at the f1+f2 frequency point.
IMO had the effect of increased 2nd harmonic was due to the delayed release of energy, one of the peaks would have to change it’s Q as the mass of the two systems is very different. But I may be wrong and as always, thank you for the help.
Another way to approach this is as coupled tuned circuits in a radio. When "over- coupled" (coupling coefficient bigger than critical) double peaks appear. "Critical" coupling gives highest output, but not necessarily highest Q, probably bad for our case.
Where do the twin resonances come from? My first thought is like Scott's, that the horizontal and vertical resonances happen at the same stylus. Interesting.
Thanks again,
Chris
By George you've got it. Modeling mechanical resonances as electrical circuits often leads to errors particularly if you use the wrong model!
If the energy going into a mechanical resonance is greater than the damping (loss) it will build until failure. Failure is often a buckling mode which then effectively changes the resonant frequency.
If the energy going into a mechanical resonance is greater than the damping (loss) it will build until failure. Failure is often a buckling mode which then effectively changes the resonant frequency.
Where do the twin resonances come from? My first thought is like Scott's, that the horizontal and vertical resonances happen at the same stylus. Interesting.
Thanks again,
Chris
Jim Williams RIP had a wonderful demo hanging in his kitchen of a dumbbell suspended on a spring. He tuned the rotational resonance about .1 Hz off of the up and down resonance and they exchanged all the energy every 10 seconds no matter how you excited the thing mechanically, brilliant.
ED - I don't think we are talking breaking cantilevers.
EDIT - Us folks in the biz who worked with Jim still miss him, he comes up in conversation almost every week.
Last edited:
Nezbleu, I am not using a STANDARD Bybee device, just something special. YOU cannot duplicate the test, but I can, and I will when I get my improved hi end system up and running.
Nezbleu, I am not using a STANDARD Bybee device, just something special. YOU cannot duplicate the test, but I can, and I will when I get my improved hi end system up and running.
Speechless.
Nezbleu, I am not using a STANDARD Bybee device, just something special. YOU cannot duplicate the test, but I can, and I will when I get my improved hi end system up and running.
So the regular old Bybees don't do whatever it is these new ones are supposed to do? What are they for, then?
Mystery keeps attraction. Any revelation is boring and would lower number of clicks to this thread.
What I mean is that you probably could never excite only H or V resonances without some crosstalk. That is the cart is actually going side to side and up and down at the same time on any of these cuts.
Thank you Scott for explaining.
Yes I agree. And the impossibility of isolating lateral from vertical resonances applies in practice to many parts of the system, not only to the cartridge.
Every interface that has some compliance, becomes an L-V cross road. (I once proposed a cross pin attachment in place of the stylus stem compliant suspension in this line of thought and the idea was wooed)
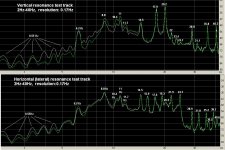
That said, for having a better comparative view of the two resonance mode spectrums, I compiled a new plot with detailed freq points (you guys are tough!).
The fundamental double resonance is almost the same in the two spectrums but past that, the picture changes, a sign of partial L-V mechanical decoupling.
Great work, and so refreshing!
Imagine, actual measurements that can be correlated to actual, well-understood mechanical phenomena, and which can also be correlated with system changes and listening results! What will become of the folks who say we can't measure anything useful?
Thank you. Correlation of measurements with mechanical theory can be realized in a simple mass -loaded (no sub chassis) TT and a simple straight arm with not many bells and whistles on it.
I bet some beers that such a combo will measure well and sound superb too.
George
Attachments
Last edited:
- Status
- Not open for further replies.
- Home
- Member Areas
- The Lounge
- John Curl's Blowtorch preamplifier part II