I'd get more M2's.
That kind of response does not help mate. I;ve quit avs for this forum thinking i might get genuine responses.
I agree, it is not the answer you want, but it is not a knee jerk answer meant to aggravate.
Fine, you get the long answer...……………….
How many surround channels do you need ?
Some of the best setups I’ve heard had the same speaker all the way around. I've even had 3 different surround setups using the same 5 speakers for all 5 channels (cerwin vega dx-9's, cerwin vega v12f, Yamaha small 8" 3 ways, and optimus lineaum ribbon mtm's).
Dolby prologic with rear dipoles 6’ off the floor / 6’ from back wall had the best immersion I’ve ever heard (never owned but heard in show rooms), but that was before stereo surround took over. Everyone seemed to want 20-20k…….. (remember ac3 ?). If I remember, they rolled freq off above a few khz for the rears also (harder to localize), and the rear fill was just fill, usually undetected so well that you knew when it was turned off.
If you trying to run rear dipoles with 5.1 stereo surround, the separate surround left/right just doesn't work, sounds like a giant blob of a gunshot from a cave off to the left. Now there are even more channels if you want, so my advice is probably too old. But maybe there is a kernel of solid info in my ramblings.
I had 2 pairs of same model 3-ways with 15’s.
Since I did not have enough for 5.1 at that time, I tried the same speaker for the center and 2 rears. Now the surround modes sounded very good, unlike the tin canny sound I perceived when different front / rear speakers.
When I rearranged it for all 3 across the front, now I had a nice wall of sound where the center didn’t stick out like a sore thumb.
If it is not an option, I’d recommend matching crossover points and slopes, then dispersion patterns.
Even the "designed to match" center still sounds different than the left/right speaker (to me).
Last edited:
The time frequency resolution tradeoff. ARTA Burst Decay is a very good way to look at this, a good middle ground has been used.Wheres the complication at?
Have a read through this document where this quote comes from
https://www.artalabs.hr/papers/im-aaaa2007.pdf
"Two problems can be noted from CSD graphs:
1. CSD has much better resolution at higher
frequency than at lower frequencies. The reason
for this is that the DFT analysis has a constant
bandwidth Δf.
2. Time axis of CSD graph is linear, so it is
impossible to compare resonance behaviour at
lower and higher frequencies with equal weight
(resonances with same Q factor at lower and
higher frequencies have a energy decay that lasts
much longer at lower frequencies). A
requirement for the replacement of time scale t
in CSD graphs with period T based scale t/T
arises."
When you have the original measurement then the parameters can be adjusted to get a better view of each end of the spectrum. A single graph posted does not offer this. It can be useful for comparisons if different devices have been measured and graphed with the same settings.
No disagreements...while I have your attention...within rew, whats the FFT view fur? Looks like REWs version of burst decay.
If you mean the Fourier mode in the spectrogram, then it looks similar but it is not the same as Burst Decay. The Wavelet spectrogram is a better option.
From the REW manual
"In Fourier mode the plot uses fixed width windows, which mean the plot has the same time resolution at all frequencies. If the plot spans a wide range of frequencies this usually means the time resolution is either too low at high frequencies or too high at low frequencies. A 100 ms window, for example, gives 10 Hz frequency resolution. At low frequencies that is a big octave fraction (1/1.4 octaves at 20 Hz), at high frequencies a very, very small octave fraction (1/1386 octaves at 20 kHz). For a time-frequency plot it would be more useful if the tradeoff between time and frequency resolution varied with frequency, using a constant octave fraction for frequency resolution rather than a constant number of Hz and so giving higher time resolution at high frequencies and lower at low frequencies. A wavelet transform can achieve that, specifically a constant Q Continuous Wavelet Transform (CWT). A constant Q wavelet transform is mathematically equivalent to using a frequency-dependent window to produce the spectrogram, which is what REW does. This method is faster than typical CWT calculations, but may produce some artefacts in parts of the response that extend to frequencies close to half the sample rate - using a higher sample rate shifts these beyond the usual range of interest."
In REW CSD is a mode in the waterfall graph, a Wavelet Spectrogram is just that, both are graphs to show frequency vs time but they are not the same thing.
CSD is Cumulative Spectral Decay and appears like a waterfall graph.
CSD is Cumulative Spectral Decay and appears like a waterfall graph.
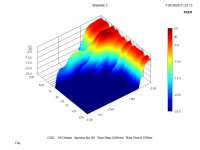
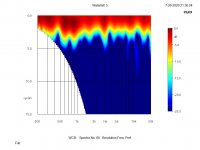
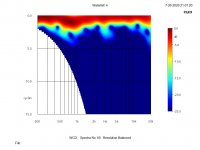
Hello camplo
Just so you can see the differences, same measurement one a CSD waterfall a Frequency biased wavelet and balanced wavelet. This is from Clio Pocket
Rob 🙂
Just so you can see the differences, same measurement one a CSD waterfall a Frequency biased wavelet and balanced wavelet. This is from Clio Pocket
Rob 🙂
Attachments
Last edited:
In REW CSD is a mode in the waterfall graph, a Wavelet Spectrogram is just that, both are graphs to show frequency vs time but they are not the same thing.
CSD is Cumulative Spectral Decay and appears like a waterfall graph.
Ok, I'm going to check it out in rew; waterfall, wavelet, FFT
Ill pick up the details eventually...whats more interesting to me, is the idea that people don't respect them (them being this "genre" of information expression; frequency and spl over time) ...like its a side note....when we could replace the normal FR with it, for a more intimate view....via these different types of graphs of this nature. When they do all the fancy stuff to the diaphragm, harmonic, geometric sculpturing....it is these very details they are trying to improve. Big money is spent on making the harmonic decay be flat and non existent.
Ill pick up the details eventually...whats more interesting to me, is the idea that people don't respect them (them being this "genre" of information expression; frequency and spl over time) ...like its a side note....when we could replace the normal FR with it, for a more intimate view....via these different types of graphs of this nature. When they do all the fancy stuff to the diaphragm, harmonic, geometric sculpturing....it is these very details they are trying to improve. Big money is spent on making the harmonic decay be flat and non existent.
Hello Camplo
That is not entirely true. JBL uses agauplas on drivers and compression drivers to both add mass and act as a dampening compound. With a compression driver you can see a 10db improvement in hash/noise looking at a ETC measurement. ETC is SPL vs Time.
A quote from Greg Timbers
"Everyone is entitled to his opinion, however, we have hard measurements in addition to much subjective listening that shows that the application of Aquaplas to the metal diaphragm of our compression drivers improves the sound. There is a slight additional HF roll off which is introduced but we can normally equalize it out in the network. Even the Beryllium diaphragm improves. The effect is in the time domain and does not show up in simple response and harmonic distortion measurements. We have seen up to a 10 dB reduction in hash on ETC measurements. The sonic effect is an increase in detail and smoothness coupled with a reduction in harshness."
Rob 🙂
"
Last edited:
Ill pick up the details eventually...whats more interesting to me, is the idea that people don't respect them (them being this "genre" of information expression; frequency and spl over time) ...like its a side note....when we could replace the normal FR with it, for a more intimate view....
The details are important and not knowing them makes discussion difficult. The time and frequency domains are linked what is in one is in the other that is what allows an fft to work. Frequency response graphs are more widely understood and generally easier to interpret.
REW has just added burst decay
Changes in V5.20 RC15:
I couldn't resist slipping in one more feature before the V5.20 release, so the waterfall and spectrogram now have a Burst Decay mode. The Burst Decay mode provides a way to more easily distinguish resonances of similar Q but different frequencies. It does this by showing the way a Gaussian-shaped tone burst at each frequency would decay, but along an axis denoted in periods of the frequency rather than time. On a period axis the extent of a decay is the same for resonances of the same Q regardless of the frequency of the resonance. The plot is produced by convolving the windowed impulse response (using whatever current window settings have been applied to the measurement) with a complex Morlet wavelet analytic signal (a Gaussian windowed complex exponential) to extract the decay envelope then resampling that decay on a period-based scale. That is repeated at 48 points per octave across the frequency span of the measurement, with 10 Hz as the lowest frequency allowed and the burst bandwidth below half the sample rate as the highest.
You can(?) buy one and send to Erin\Amir..I can't wait for the Strauss mf 2.1 review!! =D
=D
Hello Camplo
....SPL vs Time.
. ...The effect is in the time domain and does not show up in simple response and harmonic distortion...The sonic effect is an increase in detail and smoothness coupled with a reduction in harshness."
Rob 🙂
"
I had no intention of implying the geometrical sculpting to any Specific diaphragm...no matter the material (be vs al and ti) the shape is focus as well... my point was more so that much time and energy goes into manicuring what the diaphragm does in the decay region.
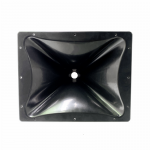
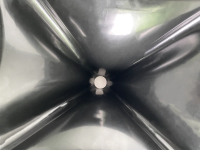
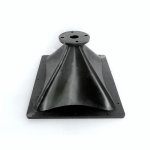
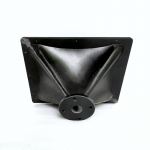
Those looking for a large horn (340 x 270 x 170mm) for 1" drivers, that allows a crossover point below 1000Hz, may be interested in this one.
It is a kind of cross-pollination of the PT-F95HF-1 (Dayton Audio H6512) and the M2 waveguide.
Available on ali for €53.
It is a kind of cross-pollination of the PT-F95HF-1 (Dayton Audio H6512) and the M2 waveguide.
Available on ali for €53.
Attachments
Last edited:
- Home
- Loudspeakers
- Multi-Way
- JBL M2 for The Poors