@ ikoflexer:
Because i use Virtins MI three years ago (before one month released the new v3.2, check for updates) and i have enough expertise with it, to get trustable results and clear plots i have some suggestions:
1)As i can see you are already familiar with the fine tuning of the frequency of test signal according to the sampling rate selected. Of course you know that after this calibration you may use rectangle smoothing window (i.e. no smoothing window function).
2) A 48Ks/s sampling rate in conjunction with 24bit depth, it is the more flexible setup.
3) For a clear plot, use a FFT size of 2048 bins and type on the record length box, the double number i.e. 2048 X 2 = 4096 points. Thus the final plot will be extracted only from 2 FFT segments, which shows clearly only the significant harmonics. I asked for this the tech support of Virtins, and they told me that this is not wrong. Moreover, the plots obtained from professional FFT analyzers like AP, have simillar appearance. Only the important harmonics are presented. In the new v3.2 you can select as well, the Harmonics order in the "Processing window".
@ the rest people
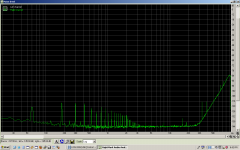
Virtins MI and as i think many other economic FFT analyzers based on PC sound cards, they reject from the measurement the noise which produced from the output of sound card (which we measure with our oscilloscopes) unless, how can do the FFT analyzer shows a SNR in the range of -110dB in a loopback test? Look please at this plot obtained from the output of a power amplifier driven at 1Wrms/8Ω:
http://www.eal.gr/0K6_THD_1Wrms_8Ohms_ASUS.jpg
What is your opinion? Is it or not a typical performance of a class A-B amplifier? Let's to see now the output noise of the amplifier from the scope:
http://www.eal.gr/Output Noise Level.jpg
For the ASUS Xonar Essence STX that i use now as interface, i remember that i had measured an output noise of 360mVrms with the scope, instead with the Virtins MI the measured noise was -116dBr. The FFT softwares (at least Virtins MI) use the method of calculation of the TOTAL POWER of noises. And in which region of spectrum is found this noise measured from the scopes? A noise floor of 360mVrms it is terrible and can be audible very easy. I have not heard a such noise from the sound card. So, this noise is found outside from the audible spectrum, is found outside from the limits of FFT analysis (max 96KHz at 192Ks/s) and thus it is filtered out from the software itself. Thus there is no reason for worry.
Another one important thing, it is that sound card based FFT analyzers are not suitable for frequency response measurements. Look at this plot:
http://www.eal.gr/CHARISMA 0K6 FREQUENCY RESPONSE 1Wrms.jpg
Is obtained from the same class A-B amplifier driven with 1Wrms/4Ω, and its -3dB point is found at 150KHz. This measurement, has obtained with a precision true RMS voltmeter. I think as well, that the economic series of FFT analyzers launched from AP can't be used for such type measurement because its bandwidth limit up to 96KHz. Just before few months, AP announced that offers an upgrade to extend the frequency limit of these analyzers up to 1MHz. The reason is obvious.
Summarizing, i have to mention that my remarks maybe are not so good formulated, but i am sure for these because are obtained on the workbench or on the PC after enough months of exhausting experimentations.
Because i use Virtins MI three years ago (before one month released the new v3.2, check for updates) and i have enough expertise with it, to get trustable results and clear plots i have some suggestions:
1)As i can see you are already familiar with the fine tuning of the frequency of test signal according to the sampling rate selected. Of course you know that after this calibration you may use rectangle smoothing window (i.e. no smoothing window function).
2) A 48Ks/s sampling rate in conjunction with 24bit depth, it is the more flexible setup.
3) For a clear plot, use a FFT size of 2048 bins and type on the record length box, the double number i.e. 2048 X 2 = 4096 points. Thus the final plot will be extracted only from 2 FFT segments, which shows clearly only the significant harmonics. I asked for this the tech support of Virtins, and they told me that this is not wrong. Moreover, the plots obtained from professional FFT analyzers like AP, have simillar appearance. Only the important harmonics are presented. In the new v3.2 you can select as well, the Harmonics order in the "Processing window".
@ the rest people
Virtins MI and as i think many other economic FFT analyzers based on PC sound cards, they reject from the measurement the noise which produced from the output of sound card (which we measure with our oscilloscopes) unless, how can do the FFT analyzer shows a SNR in the range of -110dB in a loopback test? Look please at this plot obtained from the output of a power amplifier driven at 1Wrms/8Ω:
http://www.eal.gr/0K6_THD_1Wrms_8Ohms_ASUS.jpg
What is your opinion? Is it or not a typical performance of a class A-B amplifier? Let's to see now the output noise of the amplifier from the scope:
http://www.eal.gr/Output Noise Level.jpg
For the ASUS Xonar Essence STX that i use now as interface, i remember that i had measured an output noise of 360mVrms with the scope, instead with the Virtins MI the measured noise was -116dBr. The FFT softwares (at least Virtins MI) use the method of calculation of the TOTAL POWER of noises. And in which region of spectrum is found this noise measured from the scopes? A noise floor of 360mVrms it is terrible and can be audible very easy. I have not heard a such noise from the sound card. So, this noise is found outside from the audible spectrum, is found outside from the limits of FFT analysis (max 96KHz at 192Ks/s) and thus it is filtered out from the software itself. Thus there is no reason for worry.
Another one important thing, it is that sound card based FFT analyzers are not suitable for frequency response measurements. Look at this plot:
http://www.eal.gr/CHARISMA 0K6 FREQUENCY RESPONSE 1Wrms.jpg
Is obtained from the same class A-B amplifier driven with 1Wrms/4Ω, and its -3dB point is found at 150KHz. This measurement, has obtained with a precision true RMS voltmeter. I think as well, that the economic series of FFT analyzers launched from AP can't be used for such type measurement because its bandwidth limit up to 96KHz. Just before few months, AP announced that offers an upgrade to extend the frequency limit of these analyzers up to 1MHz. The reason is obvious.
Summarizing, i have to mention that my remarks maybe are not so good formulated, but i am sure for these because are obtained on the workbench or on the PC after enough months of exhausting experimentations.
Thanks Fotios,
Thanks for explaining this. I've got the USB latency problems fixed so this weekend I will try an FFT on a headphone amp I made recently. Is 20 kHz the upper limit to the FFT? I have an old analog signal generator and my HP 332A will measure RMS voltage up to 600 kHz so I can use them for bandwidth measurements.
Jim
ikoflexer,
Thanks for checking into that. I think my problem may be a bit like the plot in the second post in the following thread:
http://www.diyaudio.com/forums/digi...5-4396-ultrasonic-noise-spectrum-graphic.html
You can see the large broad peak in noise at about 200kHz. If I can get this high frequency stuff down, I may get close to your level.
Jim
Jim, I'll try a couple of things tomorrow, check the output of the 0404 with a true rms Fluke 8920A and if I can get near an RF spectrum analyzer I'll have it checked with that too.
@fotios, yes, the MI manual helped a lot with the settings to get that result; indeed, rectangle window.
Argh, all of a sudden this
PCM4222EVM Evaluation Module(DAP13866U): TI eStore
looks really tempting.
PCM4222EVM Evaluation Module(DAP13866U): TI eStore
looks really tempting.
For THD measurements I would prefer PCM4202.Argh, all of a sudden this
PCM4222EVM Evaluation Module(DAP13866U): TI eStore
looks really tempting.
Why? Look at the numbers (data sheet):
PCM4222 PCM4202
48kHz thd+n: -108 -105
Dynamic range: 121 116
192kHz thd+n: -107 -103
Dynamic range: 118 108
PCM4222 PCM4202
48kHz thd+n: -108 -105
Dynamic range: 121 116
192kHz thd+n: -107 -103
Dynamic range: 118 108
So, with nothing at the intput (or input shorted to ground) the 0404 output measured with the Fluke 8920A shows:
* output volume pot at lowest setting: about 240uV rms in a 2MHz bandwith and about 0.72mV rms in a 60MHz bandwidth
* output volume pot at max setting: about 1.18 rms in a 2MHz bandwidth and about 1.41mV rms in a 60MHz bandwidth
* output volume pot at lowest setting: about 240uV rms in a 2MHz bandwith and about 0.72mV rms in a 60MHz bandwidth
* output volume pot at max setting: about 1.18 rms in a 2MHz bandwidth and about 1.41mV rms in a 60MHz bandwidth
Thanks ikoflexer.
It seems that some of the noise is at very high frequencies. In rereading my HP 332A manual I see that it measures past 600 kHz on up to 3 MHz, just not accurately. As your measurements show some of the noise is way up there, I may not need a low low-pass filter. That would be good. This morning my wife arranged much of my weekend, but I will try to find some time to test the output noise with a few simple passive filters. Hopefully I can cut off significant noise with a simple filter at a high enough frequency that it does not compromise the audio frequencies.
Jim
Hi Jim,
Thanks for this information and the heads-up on USB-connected soundcards. When you said RIAA, did you mean RMAA?
Have you tried any of the other audio analysis software packages to see if they exhibit the same behavior? Lots of them are freeware or shareware with a trial time. Visual Analyzer is one you might try. I'm not a computer geek.
Cheers,
Bob
Bob I have no trouble with an M Audio or Edirol external USB device. With ASIO drivers I can run two instances of Audition and do simultaneous I&O with no dropouts or glitches. I can run a full 10th octave 24bit multitone signal in loopback with a -100dB noise floor (I posted a pic in another thread).
Because PCM4202 utilizes 1bit modulator it has very low THD (less than -125dB) at signal levels -6...20dB (take a look at the graphs). I guess noise is not so important (if it is less than -100dB) for THD measurements - you can easily measure below this limit using big enough FFT window or averaging.Why? Look at the numbers (data sheet):
PCM4222 PCM4202
48kHz thd+n: -108 -105
Dynamic range: 121 116
192kHz thd+n: -107 -103
Dynamic range: 118 108
However PCM4202 has very high noise at 192kHz mode and high frequencies (>48kHz), so in this case PCM4222 could be better.
Last edited:
Hard to say how much one or the other is really better, Nicolay. But thanks for pointing it out.
In other news, I got hold of a Rohde&Schwartz FSH3 Spectrum Analyzer, 100kHz-3GHz, so I had a look at the output of the 0404 in the 100kHz to 1MHz bandwidth. I could see nothing there.
Edit: but the 0404 ground showed bumps at 110kHz, 192kHz, and 220kHz.
In other news, I got hold of a Rohde&Schwartz FSH3 Spectrum Analyzer, 100kHz-3GHz, so I had a look at the output of the 0404 in the 100kHz to 1MHz bandwidth. I could see nothing there.
Edit: but the 0404 ground showed bumps at 110kHz, 192kHz, and 220kHz.
Last edited:
Personally I have some experience with top multi-bit ADC like CS5381 and AK5394A (though not PCM4222). They are not bad and behave almost equally, but what I see from datasheet graphs - PCM4202 is better.Hard to say how much one or the other is really better, Nicolay.
Edit: Actually I believe EMU4202 uses PCM1804 and it is pin compatible with PCM4202...
Last edited:
Hi Jim, OT: I just noticed your location. UW, my latest alma matter 🙂 Oh, how much I enjoyed living in the KW area. I'd return in an instant if it weren't for other constraints...
OK, back to the topic. You might want to have a look at the Virtins software, free to download and use for a while
http://www.virtins.com/MIsetup.exe
It would be interesting if you could recreate these results with that software. IMHO the Virtins software is better.
There are quite a few spikes there, starting with the one at 60Hz. Was that image taken with the loop back cable in? I get such distortion only if my volume pots are set to maximum.
With the USB latency problem fixed I can now run RMAA at 192 kHz and 24 bit. With this higher sampling rate RMAA can show noise and THD at higher frequencies. It starts to rise, quickly, at 30 kHz.
Jim
Hey Jim
What version of RMAA are you using? The free or the PRO? As i have seen just now in the site of RMAA, only the PRO version offers ASIO support and many others. The free not. And to get the PRO i must pay 80 Euros. Have you did this? OTOH Virtins offers at least, a full operational one month trial version. Follow the advice of ikoflexer. He knows.
I am running the free version of RMAA, version 6.2.3. I have downloaded Virtins and am reading the 267 page manual. I probably will not have enough time this weekend to understand it well enough to make any reliable measurements. If I can find my box of mica, styrene and ceramic capacitors I will build a 2'nd order LR filter and see what it does. It does look like the EMU 0202 and Virtins will do much of what I need as long as I do not go above 20 kHz with my FFT's and remember it limits as a signal source. I do like my old HP 332A and would like to be able to use it to get some sense of what it happening at higher frequencies.
PS: I'm starting to think that input transformers might be a good idea for input after a DAC.
Jim
PS: I'm starting to think that input transformers might be a good idea for input after a DAC.
Jim
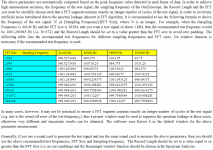
Jim, do a search in the MI help window (see Menu->Help) for SNR and you'll find a table with values, what to set the sine generator to (frequency) and what the fft windows should be etc. A few other things;
* from settings choose ADC device to be your ASIO driver
* mute everything in Windows in the "Adjust Audio Properties" (right click on the speaker icon bottom right)
* if you didn't calibrate with a rms voltmeter, then use dBV instead of dBr
* use 48kHz, 24bit for THD tests
* right click on the fft window and make some sane choices there, for instance I choose linear average of 10 samples
I agree with you, for higher than 22kHz I think something else will do a lot better than these sound cards.
Edit: added table.
Attachments
Last edited:
Just for fun...
I tried a 2'nd order LR filter, just resistors and capacitors, on the output of the EMU 0202. The filter would be roughly -6 dB at 64,000Hz. Using the HP 332A to measure distortion+noise, I have a -20dB improvement over no filter. I'm down to -56dB. Not good enough for use but it does show that the noise problem is up in this area. The filter would get to -20dB at about 200 kHz, so there is an interesting amount of noise up there. Time to stop playing with this and go back to reading the Virtins manual. I could use a general reference on digital analysis of audio signals, any suggestions?
Jim
With the USB latency problem fixed I can now run RMAA at 192 kHz and 24 bit. With this higher sampling rate RMAA can show noise and THD at higher frequencies. It starts to rise, quickly, at 30 kHz.
Jim
Hi Jim,
Nice work! Very encouraging results.
Cheers,
Bob
Something weird going on with the ASIO drivers on the 0404 usb interface.
With the ASIO driver if I set the Virtins MI software to ouput sampling of 96kHz or 192kHz, for a 20kHz sine wave, the actual sine wave comes out as 10kHz. A sampling rate of 48kHz works fine and the output is indeed at 20kHz, as chosen.
Using the MME driver works fine, 48kHz, 96kHz, or 192kHz sampling, 20kHz outputs always a 20kHz sine. Each of them also shows a significant fft bump at 160kHz and 196kHz. I'll post an image of this if people are interested.
- Status
- Not open for further replies.
- Home
- Amplifiers
- Solid State
- Issues with Emu tracker and THD measurements