relative output level comparison
this is one thing I was a little afraid of, with all my enthusiasm for small ports: the output level.until now the measurements were nearfield (for better exclusion of room influence and good S/N relation), which makes them difficult to compare between eachother, given the diameter of the ports is similar to the microphone distance.
simulations with hornresp show no (or very small) influence of port dimension/cross section. i suppose the vented box losses in the simulation are mainly related to enclosure leaks and absorptions.
thus I did a relative ground plane measurement at about 50 cm distance and equidistant to both ports with 2 V rms signal, which should give comparable output levels. the room influence is clearly visible, therefore the response graphs should only be seen for comparison between ports.
I only changed the port 1 (smaller chamber), which all the last measurements since post #104 are about.
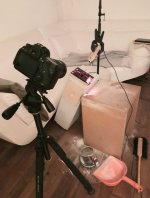
there were the ports I used:

just a short recap:
regarding chuffing the "big3d printed" and the "progressive geometry" ports behaved best until now.
the enclosure resonance output was low with all small ports (photo foreground). the big 3d-printed port is prepared for the resonance absorbers, but the openings were just closed airtightly for this test.
here is a 20 Hz - 20 kHz overview of responses, heavily smoothed (1/6 oct) for better readibility:

the image also includes separate nearfield output responses of both ports in the lower left corner. port 2 was the same for all measurements. port 2 is also responsible for the huge 350 Hz peak. notches at 70 and 120 Hz are room resonances. it's already visible that the port1 output changes a bit with different ports.
here is a detailled view of the useful output:
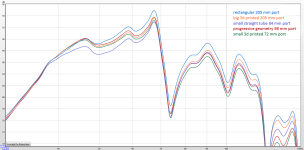
the big ports do have more output. interestingly the rectangular port and the big 3d printed ports differ quite a lot, despite the identical cross section surfaces and developments.
the rectangular port has about 0,5 - 1 dB more output in the respective passband between 50 and 150 Hz.
maybe this is related to smaller roundover outside and no flange on the inside? (papers mention this for high output)
the other most interesting port is the small straight carboard tube port. this port seems to restrict the airflow below it's output thus reducing the movement of the driver and the output of port 2 between 40-60 Hz.
At the helmholtz resonance of chamber/port 2 (35 Hz) the driver does not move and the output is not reduced.
also in it's useful passband between 50-150 Hz the straight cardboard tube has quite good output despite no roundover and flanges.
I suppose this is why the papers state that for high output a straight tube is best; while for professional high SPL use this makes sense, as with such high sound levels chuffing is no issue anyway (it's masked), in my case using such a small tube the chuffing already starts at VERY low levels and is quite annoying.
the other ports (big 3d printed, small 3d printed and progressive geometry port) are quite similar, the small 3d printed port having the lowest output in it's passband. I suppose the small roundover radius in combination with the small minimum diameter (20 mm) is responsible for that.
so it seems to be a tradeoff between most output and accepting transmission of some enclosure resonances or reducing port size with low resonance output but some reduction in useful bass SPL.
in my next measurements I will try to address the laminar flow disruption effect for small ports.
the papers mention a correlation between air movement distance and port diameter.
Last edited:
happy new year!
I did not post for some time, celebrating christmas and new year's eve, recovering form (yet another) covid infection and, most importantly, trying to get usable "particle photos" showing port air flow and turbulences.
the main issue I want to clarify is the laminar flow disruption when port diameter and air movement distance are similar.
with the last "progressive geometry port" this is happening when reducing the test frequency from (perfectly fine) 100 Hz to 50 Hz (port stalling).
trying to get usable photos was quite a challenge and after several drawbacks I finally made some progress!
I bought a small 5 mW line laser diode with a diffration lens and made several attempts to catch useful particle traces.

all attempts to use ultrasonic water mist generators or water sprayers were disappointing, because the particles are too small to be visible, even with a macro lens. they just show up as cloudy mist.
also the water particle speed for visible water drops is quite high and it's very challenging to catch the right moment when the (heavy) water drops pass through the laser light plane.
finally, blowing flour particles using an air brush compressor showed some promising results!
I am glad to get back on track and I'm also happy for a solution that will not soak loudspeakers, laser diode and enclosures in water!
I did not post for some time, celebrating christmas and new year's eve, recovering form (yet another) covid infection and, most importantly, trying to get usable "particle photos" showing port air flow and turbulences.
the main issue I want to clarify is the laminar flow disruption when port diameter and air movement distance are similar.
with the last "progressive geometry port" this is happening when reducing the test frequency from (perfectly fine) 100 Hz to 50 Hz (port stalling).
trying to get usable photos was quite a challenge and after several drawbacks I finally made some progress!
I bought a small 5 mW line laser diode with a diffration lens and made several attempts to catch useful particle traces.

all attempts to use ultrasonic water mist generators or water sprayers were disappointing, because the particles are too small to be visible, even with a macro lens. they just show up as cloudy mist.
also the water particle speed for visible water drops is quite high and it's very challenging to catch the right moment when the (heavy) water drops pass through the laser light plane.
finally, blowing flour particles using an air brush compressor showed some promising results!
I am glad to get back on track and I'm also happy for a solution that will not soak loudspeakers, laser diode and enclosures in water!
This takes me back a few years. We used a slit of conventional white light (lasers were expensive in those days) and something like a pitot probe to inject a single line of "smoke" to reveal regions of recirculation by hand. We always had the fluid flowing predominantly in one direction though rather than moving back and forth so it may be less effective in your case. The "smoke" was a range of things with us not being allowed to use the most effective with air (small enough to accurately follow the flow but large enough to see) because it was also the perfect size to be breathed in, settle and not be breathed out. We were limited to "smoke" that didn't cause a problem in the lungs. I think we used some form of oil but I am not sure given it was a long time ago. It required some cleaning after use. Almost all our visualization were done with scale models using water as the fluid rather than air which is easier. Not relevant in your case because compressibility is required for your physics which it wasn't in our case.
Wow very cool!
Can you explain for me what port stalling is and why it would occur when the diameter and air movement distance is similar?
Thanks 😊
Can you explain for me what port stalling is and why it would occur when the diameter and air movement distance is similar?
Thanks 😊
"Port stalling" is the distuption of laminar air flow at the transition from high velocity/low pressure air flow (usually inside port) to low velocity high pressure area (inside the enclosure volume and outside the box).
The correlation between port diameter and air displacement leading to flow disruption is mentioned in the philips/roozen paper. I will try to get some good particle photos to investigate what exactly is happening.
The correlation between port diameter and air displacement leading to flow disruption is mentioned in the philips/roozen paper. I will try to get some good particle photos to investigate what exactly is happening.
You went through a lot of trouble to measure the output here, but what's missing is the impedance graphs.relative output level comparison
this is one thing I was a little afraid of, with all my enthusiasm for small ports: the output level.
until now the measurements were nearfield (for better exclusion of room influence and good S/N relation), which makes them difficult to compare between eachother, given the diameter of the ports is similar to the microphone distance.
simulations with hornresp show no (or very small) influence of port dimension/cross section. i suppose the vented box losses in the simulation are mainly related to enclosure leaks and absorptions.
thus I did a relative ground plane measurement at about 50 cm distance and equidistant to both ports with 2 V rms signal, which should give comparable output levels. the room influence is clearly visible, therefore the response graphs should only be seen for comparison between ports.
I only changed the port 1 (smaller chamber), which all the last measurements since post #104 are about.
there were the ports I used:
View attachment 1246947
just a short recap:
regarding chuffing the "big3d printed" and the "progressive geometry" ports behaved best until now.
the enclosure resonance output was low with all small ports (photo foreground). the big 3d-printed port is prepared for the resonance absorbers, but the openings were just closed airtightly for this test.
here is a 20 Hz - 20 kHz overview of responses, heavily smoothed (1/6 oct) for better readibility:
View attachment 1246946
the image also includes separate nearfield output responses of both ports in the lower left corner. port 2 was the same for all measurements. port 2 is also responsible for the huge 350 Hz peak. notches at 70 and 120 Hz are room resonances. it's already visible that the port1 output changes a bit with different ports.
here is a detailled view of the useful output:
View attachment 1246945
the big ports do have more output. interestingly the rectangular port and the big 3d printed ports differ quite a lot, despite the identical cross section surfaces and developments.
the rectangular port has about 0,5 - 1 dB more output in the respective passband between 50 and 150 Hz.
maybe this is related to smaller roundover outside and no flange on the inside? (papers mention this for high output)
the other most interesting port is the small straight carboard tube port. this port seems to restrict the airflow below it's output thus reducing the movement of the driver and the output of port 2 between 40-60 Hz.
At the helmholtz resonance of chamber/port 2 (35 Hz) the driver does not move and the output is not reduced.
also in it's useful passband between 50-150 Hz the straight cardboard tube has quite good output despite no roundover and flanges.
I suppose this is why the papers state that for high output a straight tube is best; while for professional high SPL use this makes sense, as with such high sound levels chuffing is no issue anyway (it's masked), in my case using such a small tube the chuffing already starts at VERY low levels and is quite annoying.
the other ports (big 3d printed, small 3d printed and progressive geometry port) are quite similar, the small 3d printed port having the lowest output in it's passband. I suppose the small roundover radius in combination with the small minimum diameter (20 mm) is responsible for that.
so it seems to be a tradeoff between most output and accepting transmission of some enclosure resonances or reducing port size with low resonance output but some reduction in useful bass SPL.
in my next measurements I will try to address the laminar flow disruption effect for small ports.
the papers mention a correlation between air movement distance and port diameter.
Those will show much easier how well a certain port performs.
I think you can even see which one starts compressing first, because that means the impedance will collapse.
Thing is that this last part can't be done with a resistor divider method, but only with a true voltage source method (actually any impedance measurement should be done that way).
I understand why you want to see the 3D images, they also look very cool.
But I think just looking impedance curves will give probably a similar idea.
I am trying to think if a port could already show excessive turbulence but not compress yet?
I think any form of turbulence is automatically a form of compression?
Oh yeah, I didn't quite put 1 and 1 together because they were seperate posts 👍Have a look at message #310
Is airspeed the main chuffing factor?
here are two chuffing measurements of the same progressive geometry port, first at 100 Hz and second at 50 Hz: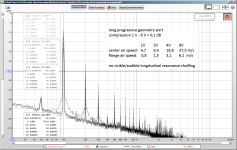
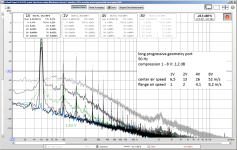
while the air speed for same input voltages is in fact higher at 50 Hz the 4 V/50 Hz tone is still much "noisier" and more compressed then the 8 V/100 Hz tone, even with smaller air speed. I strongly suspect a bigger issue here is the air movement distance compared to the port diameter. that is shortly mentioned in the roozen paper:
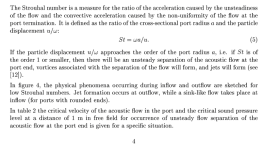
another interesting fact is that the chuffing noise has (1) only low frequency spectrum (just a tiny port resonance peak at 8 V) and (2) is excited only above around 2,5 V but then increases quite "violently"!
for comparison here is the chuffing spectrum of the small straight cardboard tube port at 50 Hz:
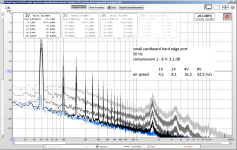
the chuffing starts at 1 V (resonance peak) and increases steadily. the spectrum is even, the port longitudinal resonance is clearly excited.
again, the roozen paper mentions for high output straight ports may be better suited.
the total energy loss due to turbulent flow however is bigger than the other ports, see compression.
sections of the ports mentioned above:
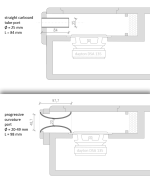
by the way, now that I measured it, the turbulent air flow for the progressive port at 50 Hz with 4 and 8 V can be seen in the impedance graph, see post #329!
conclusion: reducing the port size definitely has it's limits!
particle photography for air flow investigation
I made some progress with my particle photography. the results still lack repeatibility and the interpretation seems difficult - but of course it's great fun!one main disadvantage of photos is that it's difficult to know what period of the cycle/air movement is captured (inwards/outwards).
therefore I will rent a 120 fps camera and make slow motion videos of the lower frequency (35 Hz) port to be able to follow the air movement.
my setup includes a 5 mW line laser (90°, this can be seen on some photos), a camera set to 25600 ISO and a macro lens, a bakery "flour spreading tool" used to drop small quantities of flour into the laser beam.
here are some photos - for better comparability all show 50 Hz with 4 V. the corresponding measurements are in the previous post.
straight cardboard tube port:
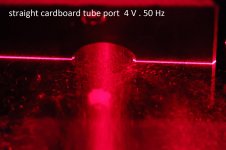
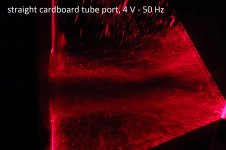
the port is "stalling" and blowing air due to turbulent flow and separation of outward and inward flow.
reason is the sudden change of straight port cross section to the half-space exterior air volume.
ironically this "problem" is the reason for the easy calculation/simulation of bass reflex speakers.
there is a clear (and purely virtual) border between uncompressed and moving air (velocity in the port) and stationary compressed/expanded air (pressure in the box and in the listening room). this simplified model cannot just be used for the ...
... progressive geometry port:
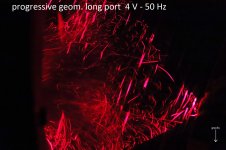


there is no strong "blowing" of air. however, it seems that the flour particles are being sucked in the port at the perimeter.
here is my first rough explanation attempt for this phenomenon and the "violent" increase of chuffing noise (previous post):
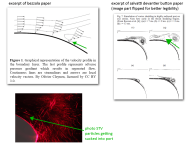
I am quite sure the main reason for the 50 Hz chuffing at higher levels is the (turbulent) flow separation influenced by a combination of adverse pressure gradient, vortex buildup and the vortices "filling up" the complete cross section of the port and thus creating a flow separation.
I also think the low frequency noise visible in the measurement is a sign of this flow separation happening inside the port flange.
Last edited:
One more observation:the turbulent air flow for the progressive port at 50 Hz with 4 and 8 V can be seen in the impedance graph, see post #329!
The turbulence inside the port flange leads to a slight raise of helmholtz resonance frequency, visible at the higher frequency peak around 50 Hz at 8 V.
consequently this turbulence would excite noise around the resulting helmholtz frequency. This may be the reason for the chuffing spectrum visible in the progressive geometry port graph in post #349.
The energy in turbulent motion is first created in the large slow coherent vortical structures that had been growing larger and weaker while the flow remained laminar now becoming unstable and starting to create smaller faster vortical motions that are aligned in different directions which interact with each other creating other smaller faster vortices. As the vortices get smaller and faster the viscous stresses get larger, dissipate the energy as heat and prevent the process from creating ever smaller vortices. This cascade of turbulent energy from large slow generating scales to small fast dissipating scales is statistically predictable and will follow a 5/3 law when the energy creating and dissipating scales are well separated and other factors are not significantly involved in the fluid motion.
Given the physics of turbulence the plot for the 50 Hz curved port appears to contains much of what would be expected. The blip and higher level of broadband energy at higher frequencies suggests there is likely other mechanisms present but turbulent motion radiating sound between generating and dissipating scales looks to be present.
This isn't the case with the straight tube which has what looks like resonances at higher frequencies with a raised broadband level. My guess, and it is only a guess, is that the tube is vibrating and interacting with the air. Aerodynamically generated sound does not look to be the dominant mechanism.
Andy thanks for your explanation!
Due to the flanges the resonance is less pronounced and higher in frequency compared to the straight port ...
... which has very pronounced longitudinal resonance excited by (interior end) chuffing, including several harmonics.
The blip around 2k is the first longitudinal resonance of the port.other mechanisms present
Due to the flanges the resonance is less pronounced and higher in frequency compared to the straight port ...
with the straight tube which has what looks like resonances at higher frequencies
... which has very pronounced longitudinal resonance excited by (interior end) chuffing, including several harmonics.
@stv The camera you probably want is a Chronos 1.4 or other models. One of the more affordable high speed cameras so you might have luck putting out a wanted message here and on ASR someone with similar interests may be willing to lend one I'd guess.
Or look for a rental / used one!
Or look for a rental / used one!
Well, yeah, that would be the right equipment!!Chronos 1.4
But before doing that i have to improve the setup and most importantly improve the particle distribution. To do that a 120 fps cam is just right (and much cheaper!!)
It is still expensive. This is the price I had remembered https://www.kickstarter.com/projects/1714585446/chronos-14-high-speed-camera
Current day top of the line mirrorless cameras like the Nikon Z8 offer 4K 120 fps video recording. Good thing is they also function as a very nice camera when not recording flour dust in air movement. However, only the recently released and still prohibitively expensive Sony A9 offers a global shutter. What's the exposure time that you are using?
for the still images I used between 1/25 and 1/80 s.What's the exposure time that you are using?
the images in post #350 were all shot with 1/50 except for IMG_9518 that was shot at 1/10.
for video I just tried between 180 and 360° shutter.
as I just have a 60 fps camera at hand at the moment, I'll have to experiment.
for in depth inspection of frame-by-frame a 360° shutter seems pretty usable, even if for video or film 180° is recommended to get a fluid image. but that's not my goal here.
after the latest test results I thought about a possible reason to use slot ports.I was also quite surprised to see what Genelec achieved with their slot ports
there are some quite contradicting constraints for ports:
- effective (central) port cross section surface should be as small as possible to reduce port size and avoid bad (increased) port length/diameter ratio.
- port surface at both ends should be as big as possible to reduce air speed and possible creation of turbulences at port ends (port blowing) and chuffing (excitement of port resonance).
- however, a curved port wall potentially leads to excitement of vortices in the port with resulting low frequency turbulence and increased compression in case of higher SPL.
simulation of big and small curvature radius by roozen (by the way this seems to be included in the AES paper, but not in the philips-paper):
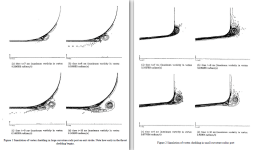
the big curvature vortices can "fill up" the entire port cross section, while the straight port vortices will stay out of the port and mostly out of the port projection.
the salvatti/devantier/button paper states:
NFR ("normalized flare rate") = L/2r
where
L = length of port
r = curvature radius
a NFR of 1 means a circular curved port wall, while a NFR of 0 means a straight wall port.

the big curvature vortices can "fill up" the entire port cross section, while the straight port vortices will stay out of the port and mostly out of the port projection.
the salvatti/devantier/button paper states:
I added the text in italics.The most obvious conclusion is that a large (port wall curvature) radius is clearly better at lower levels. Also, it appears that the more extreme the port flare, the worse the compression at high levels. In addition the straight port starts out with about 2 dB less output than any flared port, but it compresses less dramatically than would be expected.
A close examination points to a "sweet spot", where a moderat amout of flare (NFR = 0.5) works better than all others.
NFR ("normalized flare rate") = L/2r
where
L = length of port
r = curvature radius
a NFR of 1 means a circular curved port wall, while a NFR of 0 means a straight wall port.
so with a slot port and using curved walls in one axis/plane of the port and straight walls in the other you may get a useful combination of both concepts:
- good efficiency at low levels
- less compression at high levels

(my "flat port")
Last edited:
- Home
- Loudspeakers
- Multi-Way
- Investigating port resonance absorbers and port geometries
