And that goes both ways.From demonstrating your empty assertions? That's your homework.
I would like to stay constructive and positive here please.
No reason for snarky comments.
I think I have provided already quite some insight about what actual literature says about all these things.
B-force, how would you choose to determine boundary layer thickness experimentally? Maybe transparent port with a fine powder in the air? Or maybe moving a hot wire flow sensor to different areas? Just curious what you might think of.
In simulations the user needs to define the boundary layer size because different formula are used there, AFAIK. Andy might chine in here.
Boundary layer thicknesses are useful for steady flows along, say, a wing or a pipe but are less so with oscillating flow. The oscillating flow in and out of a port will have a region near the surfaces where viscous forces dominate inertia forces and the flow is laminar. This will change in size as the velocity varies from zero to a maximum. Boundary layer behaviour changes substantially if the flow is accelerated or decelerated making a quasi-steady approach doubtful. In addition the Reynolds number is around the transition region between laminar and turbulent making both laminar and turbulent boundary layer data of limited usefulness.
I'm not sure there is a particularly useful form of boundary thickness(es) in the case of an oscillating flow in a short port. Given a definition of one it could be measured with a laser or hot wire anemometer which can be borrowed or hired from a lab. Doesn't look a reasonable thing to be doing to me but it is just about viable if extremely keen.
What is of practical importance is the change from essentially unsteady laminar to unsteady turbulent motion. Listening to the sound from the flow is a pretty good way to measure this. Simulating the 3D unsteady flow accurately is likely to be the most efficient way to understand and quantify the details of the relevant physics (e.g. port shape, position, surface roughness,...). It could be done with multiple builds and measurement but this is time consuming, costly and the inevitably limited amount of measured information will leave people speculating and guessing about the details as can be seen in this thread. 3D unsteady simulations predict everything everywhere removing any need for speculation subject to the physics being understood (i.e. extracting the right information from the predicted fields) and confirmation that the relevant physics has been captured by the simulations and not lost in the modelling assumptions (e.g. measuring a few relevant quantities).
And a dual port halves the air speed. But each duct is twice as long compared to the single port configuration, can you explain me why?Of course there is a limit when the port air speed gets too high.
Sorry for entering with another basic question, I was just asking myself why Genelec opted for a dual slot-port configuration with their high SPL model S360.
And a slot-port even more than a round port.Dual port has a worse combined port cross section surface/circumference ratio.
So the dual slot port:
- Is longer, thus has a lower resonance frequency
- According to your last reply to me might create a higher level resonance
- Has more circumference that could cause turbulence than an single round
- Halves the air speed
Last edited:
Sorry, I missed your message.B-force, how would you choose to determine boundary layer thickness experimentally? Maybe transparent port with a fine powder in the air? Or maybe moving a hot wire flow sensor to different areas? Just curious what you might think of.
In simulations the user needs to define the boundary layer size because different formula are used there, AFAIK. Andy might chine in here.
Try to use the @ symbol, directly followed by the user name (in my case it's an underscore in my name, not a regular minus symbol)
Measuring these things isn't easy for diy'ers.
Back than we had flow sensors, which directly measure velocity and are tiny as well. There are DC flow as well as AC flow sensors.
Problem is, that they aren't cheap.
Although, sometimes you will see some (very) old DC flow sensors popping up on ebay for a couple of hundred bucks.
You can very clearly measure the boundary layer.
In fact, in my experience it's so significant, that positioning the sensor a little off, is enough to get different readings.
Especially with more rectangular shaped tubes.
BTW, we need to be careful that we keep talking about the same thing here.
Because I noticed that some like to throw everything on the same pile. (or at least it seems).
- We have the low frequency piston range behavior. There where the port acts as a bandpass filter with a slope of 12dB per octave.
- The region when the standing waves (resonances) start.
When I talk about performance, Q-factor, boundary layer effects, it's all happening in the first piston region.
It's true that AC effects are different than DC effects. Mostly because air has mass, so the boundary layer has to to build up.
At the same time a port has a clear bandpass response, meaning that the frequency response already collapses.
So the effect of the boundary layer is only important at the tuning frequency of the port.
Since the air there is fast enough to have a maximum in the response of the port, I don't see why the boundary layer effect couldn't keep up?
Thanks for the insightful reply! I see what you mean about boundary layer size changing with the air speed.Boundary layer thicknesses are useful for steady flows along, say, a wing or a pipe but are less so with oscillating flow. The oscillating flow in and out of a port will have a region near the surfaces where viscous forces dominate inertia forces and the flow is laminar. This will change in size as the velocity varies from zero to a maximum. Boundary layer behaviour changes substantially if the flow is accelerated or decelerated making a quasi-steady approach doubtful. In addition the Reynolds number is around the transition region between laminar and turbulent making both laminar and turbulent boundary layer data of limited usefulness.
I'm not sure there is a particularly useful form of boundary thickness(es) in the case of an oscillating flow in a short port. Given a definition of one it could be measured with a laser or hot wire anemometer which can be borrowed or hired from a lab. Doesn't look a reasonable thing to be doing to me but it is just about viable if extremely keen.
What is of practical importance is the change from essentially unsteady laminar to unsteady turbulent motion. Listening to the sound from the flow is a pretty good way to measure this. Simulating the 3D unsteady flow accurately is likely to be the most efficient way to understand and quantify the details of the relevant physics (e.g. port shape, position, surface roughness,...). It could be done with multiple builds and measurement but this is time consuming, costly and the inevitably limited amount of measured information will leave people speculating and guessing about the details as can be seen in this thread. 3D unsteady simulations predict everything everywhere removing any need for speculation subject to the physics being understood (i.e. extracting the right information from the predicted fields) and confirmation that the relevant physics has been captured by the simulations and not lost in the modelling assumptions (e.g. measuring a few relevant quantities).
luckily it sounds like in order to do the simulations you suggest, the user would not need to have existing knowledge of the correct boundary layer size for meshing?
Very cool, way ahead of me. My bicycles run latex tubes. In that application it's porous and deflates relatively rapidly.I had to tune my "air pump volume" slightly down for best results.
You were provided a link showing an explicit example of the common resonant issues with MLTL but ignored it. Agree though that chasing pointless cats dilutes the thread.And that goes both ways.
in my simplified and maybe odd words, maybe:can you explain me why?
the helmholtz resonator model is built of two elements, similar to a load suspended on a spring:
- the "spring", the enclosure air volume being compressed and expanded.
- the "weigth", the air inside the port.
if you think of slicing the enclosure and also the port exactly in two halves at the port axis, you will get two helmholtz resonators with the same resonance frequency (but the Q is probably different).
the volume is 50%
the port cross section surface is 50%
the port lenght is still the same (100%)
If, however, you took one of the halves of the port plus enclosure from above (with correct tuning) and then doubled the enclosure again to 100%, that would lower the resonance frequency.
In order to compensate you could either re-establish the 100% port surface or make the port shorter.
the other way around happens if you add another port (or just increase port surface). if the enclosure volume stays the same the port lenght must increase.
- Is longer, thus has a lower resonance frequency
no, the longer port just compensates for the added port surface.
maybe. more port surface reduces the air speed and the induced losses. also, with reduced air speed the entrance and exit turbulences are lower.
- According to your last reply to me might create a higher level resonance
yes, but as you correctly state, it may still be better than a very wide slot port.
- Has more circumference that could cause turbulence than an single round
yes! except for effects of boundary layers, and end correction factors of ports (depending on the flange there is some air outside the port which acts as added port air).
- Halves the air speed
luckily it sounds like in order to do the simulations you suggest, the user would not need to have existing knowledge of the correct boundary layer size for meshing?
Not really because there are no boundary layers of much relevance involved. The Reynolds number is so low that a turbulence model is not applicable. The mesh and time step need to be small enough to resolve the gradients in space and time of the solution variables (e.g. 3 velocity components, density and temperature though there are other sets of solution variables that may be used). What makes a solution challenging is that in and around the port the gradients in the solution variables vary strongly in space requiring a small mesh size but slowly in time (if we set aside sound waves) while away from the speaker the air is effectively stationary and does not need solving. The gradients in the sound waves on the other hand only require a relatively coarse mesh in space but a fine one in time plus the gradients in acoustic variables are significant throughout a room and not just around the port and speaker. In addition the common approach for addressing aeroacoustic cases like this (small acoustic source region within large acoustic domain) with an incompressible flow around the speaker, an acoustic solution throughout the room driven by sound sources from the incompressible flow won't work because it will prevent the port from resonating because the air within the speaker cavity needs to compress for this to happen.
One could simply use a fine mesh for the flow with a fine time step for the acoustics (being careful with one or two numerical issues) but then the computational resource required would be large. If a solution requires more than an overnight run on a decent desktop computer it is moving away from being relevant to hobbyists at home (unless they are rich and keen and prepared to pay substantial sums to run on remote clusters).
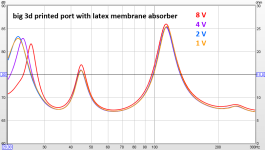
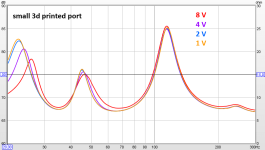
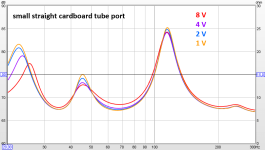
impedance plots!
i did impedance mesurements of three different ports, using different output voltages each.(I finally started using REW for impedance measurements!)
- big 3d printed port (still with latex membrane absorber, but i suppose the absorber has not that much influence here)
- small 3d printed port
- small cardboard tube port


some observations:
- the small ports have a very strong effect on the lower tuned big chamber (see lowest impedance peak!), which remained the same for all measurements. the loudspeaker is a 6th order bandpass with two parallel chambers and ports. the tuning of the big chamber (35 Hz) is far below the tuning of the small chamber (around 65 Hz), thus the small chamber/port acts only as flow resistance for the lower tuning. the small port reduces the air flow, thus the lower impedance peaks get much lower with higher input! keep in mind that while this is quite interesting it's not directly subject to this investigation and should be neglected.
- with 8 V input all impedances are slightly higher (around 1 ohm). I suspect this is due to voice coil heating up.
- impedances of the big 3d printed port does not change very much with increased level, except for the frequency of the lowest peak. I suspec this change is due to the driver reaching and exceeding it's Xmax at those low frequencies. the port seems to behave very linearly in the range of chamber 1 (small chamber upper impedance area), which is under investigation here.
- the small 3d printed port: at 8 V the middle impedance peak is reduced and (most importantly) the upper impedance valley is higer. this corresponds to the chuffing in the acousic measurements! up to 4 V there was no chuffing and the impedance plot confirms that.
- the small cardboard tube port: middle peak and upper valley is generally less pronounced, thus lossy (corresponds to chuffing from 1 V up). and the losses get bigger with any increase of level, from 1 V up. this correspond to the chuffing measuements!
Last edited:
I should add:the small port reduces the air flow, thus the lower impedance peaks get much lower with higher input! keep in mind that while this is quite interesting it's not directly subject to this investigation and should be neglected.
in fact it is interesting, because looking at the big and small 3d printed ports it shows that while the air flow below resonance is quite strongly affected by port cross section (thus reduced lower impedance peak with small port), the resonant flow is not that much affected, see upper peaks up to 4 V (8 V is compromised by chuffing for small port)!
It's about acoustics and absorption, not just a MLTL.You were provided a link showing an explicit example of the common resonant issues with MLTL but ignored it. Agree though that chasing pointless cats dilutes the thread.
The boundary layer effect also exist with laminar flows.Not really because there are no boundary layers of much relevance involved. The Reynolds number is so low that a turbulence model is not applicable
In fact, that's the default school test setup, since we can use classic physics on laminar flows and therefor are much easier to solve and calculate on.
I see you keep repeating boundary layer effects with turbulence, but I just don't understand why?
The boundary layer effect is always there.
Open any standard thermodynamic book and it will have an entire chapter on it.
It's actually already within the first year where students learn why the expected output is not the same as the input.
Last edited:
Have a look in the paper(s) that i mentioned (i need to look it up where exactly). The boudary effect will lead to turbulences, if the port wall curvature gets too "steep".I see you keep repeating boundary layer effects with turbulence, but I just don't understand why?
Yes, that's how boundary layers work?Have a look in the paper(s) that i mentioned (i need to look it up where exactly). The boudary effect will lead to turbulences, if the port wall curvature gets too "steep".
There is a point where it starts to flip.
I am am a bit confused what you're trying to say, but I gave a feeling there is some miscommunication here 😉😁
I suspect I just don't know enough ... I'll keep doing it the experimental way and leave the physical explanation to the more educated. 😊there is some miscommunication here
Ha, no worries!I suspect I just don't know enough ... I'll keep doing it the experimental way and leave the physical explanation to the more educated. 😊
Keep up the nice work btw!
Always great to see the theory put in practice and see all the little nuances.
👍😎😊
Hopefully I can do some things next week, since I finally have some more time, as well as my gear finally ready again.
You can actually see that in the steady flow sims I showed earlier - there is a thin layer of turbulent energy along the wall.
But should it be there or is there something amiss with the modelling assumptions? If you have opted to include something like the k-e turbulence model (there are loads but this is perhaps the most common general one) it assumes the Reynolds number is large enough for the length scale of the turbulent dissipating motion to be several orders of magnitude smaller than the generating scales so that some simplifying assumptions about the turbulence can be made. Regardless of whether the Reynolds number is sufficiently small the normal boundary condition treatment will impose on the cell next to the wall some values that are only valid for the inner/equilibrium layer of a boundary layer. In a high Reynolds number boundary layer there is a thin layer next to the wall that is laminar then a layer where the turbulence is sufficiently intense for the production and dissipation to be in equilibrium with transport negligible (assumptions can be made) then there is a larger outer boundary layer where the turbulence is less intense and the transport significant. Even if the first grid point is not in the inner turbulent layer of a high Reynolds number turbulent boundary layer turbulence quantities are likely to be imposed regardless. One cannot be adamant because there are a number of alternative ways of imposing turbulent boundary conditions and they can behave differently when conditions are outside those assumed.
The oscillating flow in our port is not the steady boundary layer flow in a pipe but the Reynolds number of a pipe is still useful as a check on the flow being laminar, low Reynolds number turbulent or high Reynolds number turbulent. Actually we already have this information indirectly from the sound emitted but it is still good to check that the physics is as expected.
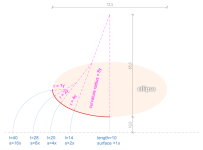
I did a geometric attempt to find a port shape that makes sense (to me, at least!).
in my simplified understanding there is a inverse correlation between air speed and allowed port wall curvature (I know, it's far more complex ... I'll read the papers again...).
so I made a rough sketch, assuming a spherical propagation of pressure waves (it's probably rather oblate speroid with some further complication at the boundary) and for every doubling of "assumed spherical pressure surface" i halved the curvature radius. the initial value was just a guess, to get a port length similar to my previous 3d-printed port:

the shape resembles very much (or actually is?) an ellipse (light orange background).
In the paper by Salvatti, Button and Devantier they describe the "NFR" (normalized flare rate), simplifying the port curvature to one fixed radius along the port.
in their report they ofter refer to optimal solution for heat exchange, thus I assume it is mainly directed towards professional (high power) PA systems.
furthermore they state in the general conclusions:
so, following item 2) the port may need a larger taper at the inside. this should be perfectly applicable to my (hifi) use. (edit: after all, there is high/low pressure inside the enclosure, but just atmospheric pressure outside).
item 3) is just as I realized when investigating the port chuffing and "port stalling" phenomenon.
for the "high level NFR near 0" (basically a straight port with blend radius) in item 4) i assume they accept port exit chuffing (blowing) to a certain extent for high power PA use. I assume this is not useful for high quality reproduction.
I am still reading this paper and realize there is much more for me to (try to) understand!
in my simplified understanding there is a inverse correlation between air speed and allowed port wall curvature (I know, it's far more complex ... I'll read the papers again...).
so I made a rough sketch, assuming a spherical propagation of pressure waves (it's probably rather oblate speroid with some further complication at the boundary) and for every doubling of "assumed spherical pressure surface" i halved the curvature radius. the initial value was just a guess, to get a port length similar to my previous 3d-printed port:

the shape resembles very much (or actually is?) an ellipse (light orange background).
In the paper by Salvatti, Button and Devantier they describe the "NFR" (normalized flare rate), simplifying the port curvature to one fixed radius along the port.
in their report they ofter refer to optimal solution for heat exchange, thus I assume it is mainly directed towards professional (high power) PA systems.
furthermore they state in the general conclusions:
2) When designing a port for maximum acoustical output both the inlet and exit fluid dynamics should be balanced. The geometry for best exit flow is different than that for inlet flow. Inlet flow is best with a very large taper (NFR of 1.0). For exit flow a very narrow taper is best (NFR less than 0.5). This points to an NFR of 0.5 as the optimum.
3) Inlet head loss should be minimized. Use port profiles which do not have any sharp discontinuities. This requires all port edges to have a blend radius of at least 20% of the minimum diameter (as per figure 24).
4) For flared ports, choose an NFR to match the design application and intent. For lowest harmonic distortion at low levels, use NFR’s near 1.0. At moderate levels, NFR’s near 0.5 work best. At high levels, NFR’s near 0 are desirable (though the above blend radius should still be used). For the best compromise at all levels, NFR = 0.5 appears to be optimum.
so, following item 2) the port may need a larger taper at the inside. this should be perfectly applicable to my (hifi) use. (edit: after all, there is high/low pressure inside the enclosure, but just atmospheric pressure outside).
item 3) is just as I realized when investigating the port chuffing and "port stalling" phenomenon.
for the "high level NFR near 0" (basically a straight port with blend radius) in item 4) i assume they accept port exit chuffing (blowing) to a certain extent for high power PA use. I assume this is not useful for high quality reproduction.
I am still reading this paper and realize there is much more for me to (try to) understand!
Last edited:
- Home
- Loudspeakers
- Multi-Way
- Investigating port resonance absorbers and port geometries