I am always astonished that people just parrot absolute statements without even considering a femto-bit of context.The web ist still full of comments like "never place your sub in the corner" I was astonished like this was something everyone would automatically agree on who is into hifi or high end.
What I am even more astonished about, is that it seems to be like growing weeds, you also never know when and how it will pop-up.
Once you finally cleared one part, another part seems to be growing over again 🙁
Here Mr Jobst from Jobst Audio Germany measured in the near field some mm close to reflex port and loudspeaker cone. Orange line is the driver the other two are the two reflex ports.
He did that to compare with the ground plane measurement.
Here you see what I saw, too, while measuring a reflex port that it works pretty wideband and adds up really nice where the driver decays.

He did that to compare with the ground plane measurement.
Here you see what I saw, too, while measuring a reflex port that it works pretty wideband and adds up really nice where the driver decays.
I think you summed up most of audio. Copying. Very little innovation.I am always astonished that people just parrot absolute statements without even considering a femto-bit of context.
What I am even more astonished about, is that it seems to be like growing weeds, you also never know when and how it will pop-up.
Once you finally cleared one part, another part seems to be growing over again 🙁
Polyester wadding inside cabinets. Everyone does it. Does it do anything? Does anyone measure what it does? Not effectively. When you do, you find it's nearly useless in the way it is being used. Just an example that I have extensive measurement experience with.
And last but not least: importance of exact bass reflex tuning should not be overrated.
I realized this once more, when doing low frequency sweeps: The influence of speaker placement and listening spot location in a room makes any tuning difference meaningless. Even more with one single subwoofer...
Some measurements, simulations and observations to confirm my assumption quoted above.
speaker and mic positions are interchangable (for relevant low frequency range)
Maybe this is common knowledge and it seemed clear to me after thinking about it, but I can confirm it now and save myself and anyone else some tedious carrying around of heavy speakers: just set up the speaker in your listening spot and move around the mic or your head to measure and listen for room influence!simulation with REW room sim - toggle images with arrow keys:
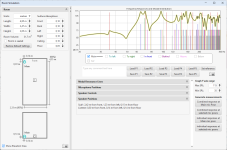
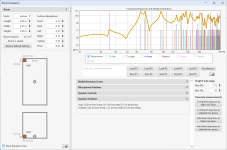
there are some minor changes in the response curve, but those are just result of not being able to perfectly match speaker and "head" position.
the room simulated is the one I also did the following measurements in. There is a strong first longitudinal mode at 35 Hz that coincides with the tuning of my subwoofer which is not ideal, but this is not the room this speaker is made for anyway.
measurement with exchanged positions for speaker and mic:
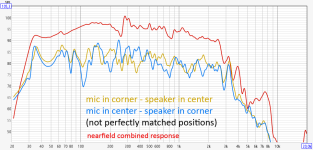
again, the slight differences are because exact matching of speaker and mic positions was (too) difficult. The lower range up to about 100 Hz is very similar.
the red trace is the combined (driver+port) nearfield response of the speaker, just as reference.
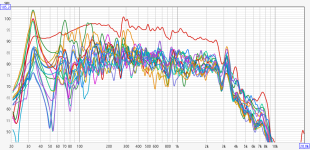
all measured response curves of different mic and speaker positions
just to see how much the positioning changes the response. Differences can be >45 dB in the lower range for the worst cases!Red trace again is the combined nearfield speaker response.
measurement and simulation, influence of closing the door
Simulation done with REW room sim.the response shown in dark purple is the same in the next image, with plan showing the positions.
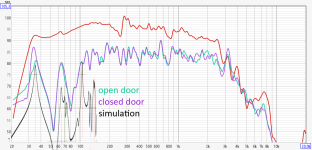
simulation matches perfectly in the lower range, any deviation in the upper range is probably just my inaccurate replication of actual positions.
it seems to be a good idea to keep the listening room door open, if possible!
moving around the speaker
that was before I realized that moving the mic would have the same effect...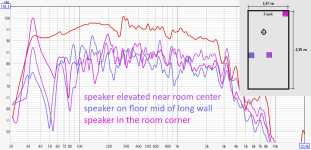
the huge 35 Hz peak is due to the room length mode. Except for this peak, locating the speaker in the room corner seems to work fine, just as Freedom666 mentioned:
I had good experience with corner placement
... and the most revealing graph for this thread: influence of position vs. completely stuffing the speaker port
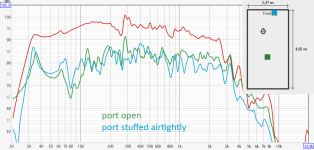
Both responses are nearly identical. Moving the speaker can make up for the complete loss of port output!
in this case and for this room it would be beneficial to seal the port in order not to excite the longitudinal mode!
Having two or more (sub)woofers/speakers would of course also be much better.
I have to admit that I never used the REW room sim tool before - it is incredibly useful and intuitive, just move around the speaker with the mouse and watch the response curve change! Amazing!
EDIT to avoid any misunderestandings: I used the REW simulation tool floor plan to indicate speaker and mic positions, the graphs are measurements, however (except where indicated!)
Last edited:
I plan to make one or two smaller ports to better test for the turbulent compression behaviour.
I made an additional, smaller port, defining a max. SPL of 82 dB (big one: 90 dB)
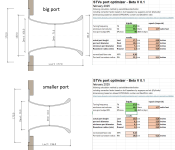
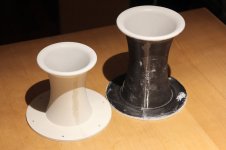
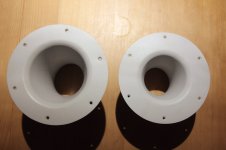
The bigger port, as noted before, did not really show explicit signs of port compression before the driver ran out of Xmax.
The smaller port still behaved quite well and I think I need to adapt the min. allowed strouhal number calculation in my optimizer tool. This will result in smaller port dimensions for the same required SPL.
The tuning of both ports differs very slightly - blue: big port, red: smaller port:
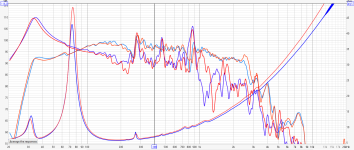
The smaller port tuning is more at 37 (as planned). Bigger port ~ 38 Hz, which is a deviation of 3%.
If no one objects I would define this as acceptable tolerance. I'd be happy to read about tuning accuracy of any other port made with the optimizer tool!
As noted in post #956 the tuning frequency (impedance minimum) and the max. port output peak do not correspond. The port peak is below tuning frequency.
Compression, THD and H3 behaviour of these ports at tuning frequency and below tuning freq. in the next post!
speaker and mic positions are interchangable (for relevant low frequency range)
again, the slight differences are because exact matching of speaker and mic positions was (too) difficult. The lower range up to about 100 Hz is very similar.
... and the most revealing graph for this thread: influence of position vs. completely stuffing the speaker port
View attachment 1474537
Both responses are nearly identical. Moving the speaker can make up for the complete loss of port output!
Great post ! Great experimentation !
How reciprocity works was one of the best things I've ever learned about subs/sound.
I remember having 5 really large subs in a very big room, trying to figure out how the heck I could ever arrange them to smooth out response.
Hooray for reciprocity ! So easy to walk around with mic. Placed one at a time, building off the ones already placed. Even ended up hanging a double 18" from the ceiling... cause I could lift the mic to the ceiling and know what to expect 😀
And heck yes to your most revealing comment. Placement matters so dang much, the only intrinsic sub tuning I will do in out on the driveway.
Indoors, I use reciprocity or close-up, and just live with the responses after finding best placements possible.
Yup. All the lovely measurements we see getting posted 99% of the time have little to nothing to do with the actual in room low bass. Because people need to use their rooms for life, not only sound. The privileged few that can have a sound only room should take note of this. REW is a great tool for getting the rough positions. I have used it to analyze my measuring room. As the position within the room dominates the measurements. Personally I use a moving mic and then average method as this gets me as close to a groundplane measurement as is to be hoped for.
Mark
Mark
Compression behaviour of the ports described in post #966 (just above):
I made screenshots of RTA graphs, as I did before, to collect data about compression (actual SPL level), distorsion and chuffing/turbulent noise.
first the big port, created with optimizer, dimensioned for 1 dB compression at 90 dB SPL:
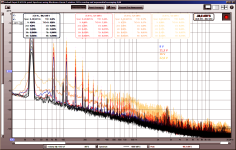
the image shows overlaid RTA screen shots. for better visibility of low frequency noise (turbulent air in the port) I made the highest level SPLs in colour.
the orange and yellow graphs show elevated noise between the distorsion peaks.
As I mentioned earlier, the driver was very much at it's thermal and Xmax limit with those levels.
This is why I made the smaller port that should show turbulent compression behaviour before any driver related effect (dimensioned for 1 dB compression at 82 dB SPL).
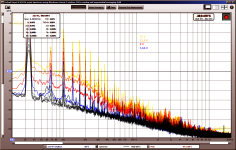
I show the port output peak frequency (33,7 Hz) instead of the tuning frequency (37 Hz) here and the low frequency turbulent noise (below 500 Hz) is clearly visible. There is also a hint of longitudinal resonance chuffing around 1 Khz.
I should add that while the turbulent noise is visible on the RTA graph it was not really audible, because of the masking effect of the high output bass drone and the rather high distorsion. I would suppose that compression up to 2 or 3 dB might be perfectly acceptable for single peaks, if used for music.
(I made several other graphs that I will not bore you with!)
For better readibility, the compression, THD and H3 graphs, related to the port output SPL (1m/4pi).
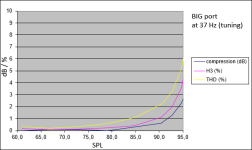
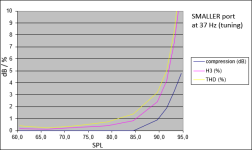
Both graphs show that the ports behave better than predicted by my optimizer tool.
BIG port 1 dB compression happens at around 92 dB SPL instead of 90 dB (eventually also related to driver limit).
SMALLER port 1 dB compression happens at around 90 dB SPL instead of 82 dB.
Then I also used the port output peak frequency instead of the tuning frequency.
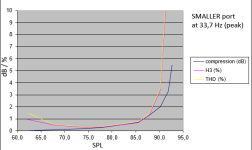
This frequency is where port output and the onset of turbulent airflow have the strongest effect, see RTA graphs above. This is also the frequency of local Strouhal number minimum.
1 dB compression at 87 dB SPL (instead of predicted 82 dB). the prediction is not that bad anymore!
It is also clearly visible that for the port output peak frequency the distorsion is low (low driver excursion, compare to previous graph), but it "explodes" once the airflow becomes unsteady, leading to driver unloading and huge increase of driver excursion resulting in high H3 ("clipping")
I then tried to verfy (or better: falsify) my "Lact/Dext - min allowed STR" formula as I proposed in post #844.
while this formula seems to be fine for the ports that I tested then (higher Lact/Dect numbers, thus: long narrow ports), the accuracy is lacking for shorter ports.
Here is the new, updated correlation formula with graph.
As before it shows the minimum allowed Strouhal number for max. 1 dB of compression related to port length/exterior diameter ratio:
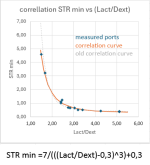
The dotted grey graph shows the old formula.
Here is a lower (Lact/Dext) detail, better showing the difference:
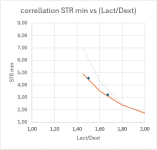
The new formula will result in smaller port diameters for short ports.
The formula should be pretty accurate for longer ports, see the collection of blue dots from (Lact/Dext) bigger than 2,5.
For shorter ports I will do some more testing.
I already prepared an optimizer tool update (Beta 0.2) that includes this new correlation formula.
I also managed to get the port geometry graph to show actual dimensions and still keeping the X and Y axis scaled similarly (the trick is to include an invisible diagonal graph related to the maximum dimension).
I'll post the new tool shortly, after some final testing!
Last edited:
By the way: the apparent increase of THD and H3 at low levels is actually rectified mains hum (~ 100 Hz and multiples).
Awesome testing and verification. 1db of compression is purely academic. Most listeners will notice 3db changes. So this is great news. Smaller ports are definitely easier to work with.
As an aside you see minus 3db low frequency cut off posted routinely. It in audible terms means almost nothing. Posting minus 10db is where you have a half as loud point. Just because it is a measurement convention doesn't mean it actually makes sense!
What you have posted definitely does make sense. And is most useful. Looking forward to the next version of the spreadsheet.
Mark
The thing I am still a bit curious about, is the compliance offset on the driver.I made an additional, smaller port, defining a max. SPL of 82 dB (big one: 90 dB)
View attachment 1475580
View attachment 1475583 View attachment 1475582
The bigger port, as noted before, did not really show explicit signs of port compression before the driver ran out of Xmax.
The smaller port still behaved quite well and I think I need to adapt the min. allowed strouhal number calculation in my optimizer tool. This will result in smaller port dimensions for the same required SPL.
The tuning of both ports differs very slightly - blue: big port, red: smaller port:
View attachment 1475584
The smaller port tuning is more at 37 (as planned). Bigger port ~ 38 Hz, which is a deviation of 3%.
If no one objects I would define this as acceptable tolerance. I'd be happy to read about tuning accuracy of any other port made with the optimizer tool!
As noted in post #956 the tuning frequency (impedance minimum) and the max. port output peak do not correspond. The port peak is below tuning frequency.
Compression, THD and H3 behaviour of these ports at tuning frequency and below tuning freq. in the next post!
Mostly because front and back of the tube aren't exactly the same (although close)
Mounting the inner piece on/inside a piece of bracing would be even better in theory.
Agreeing that it may be part of the distortion products, the Damper going non-linear. With normal testing tools we could look at phase and impedance at the same time and some indication if it is mechanical in nature and at what frequencies and what power levels. Generally you should see the anomalous bumps in the Impedance first, and then in the phase as the phase is dominated by the mechanical movement of the cone and damper. Yes electricity is faster than a moving woofer cone or suspension damper.The thing I am still a bit curious about, is the compliance offset on the driver.
Mostly because front and back of the tube aren't exactly the same (although close)
Mounting the inner piece on/inside a piece of bracing would be even better in theory.
The other way would be to use a strobe, but that is like chasing rabbits. Never easy, and incredibly frustrating.
Mark
I'd agree at 1kHz, where +10dB sounds "twice as loud".1db of compression is purely academic. Most listeners will notice 3db changes.
Just a +5dB increase sounds "twice as loud" at 30Hz..
Down at the lower range of hearing, half the amount of change can sound half as loud as in the mid range .
Around a 1.5dB change in the 20-40Hz range is the equivalent of a 3dB change at 1000Hz.
A -3dB change at low frequencies at low level can be the difference between hearing and not hearing a fundamental frequency.As an aside you see minus 3db low frequency cut off posted routinely. It in audible terms means almost nothing. Posting minus 10db is where you have a half as loud point. Just because it is a measurement convention doesn't mean it actually makes sense!
Because of our hearing "equal loudness contours", at low frequencies, -3dB (half power) is close to half as loud, and -10dB might be considered useless.
Following the 82dB SPL line from 40Hz down/up we see it equal to 40dB SPL (or Phons, the subjective unit of loudness) at 1kHz, a "whisper level".BIG port 1 dB compression happens at around 92 dB SPL instead of 90 dB (eventually also related to driver limit).
SMALLER port 1 dB compression happens at around 90 dB SPL instead of 82 dB.
An 8dB difference in the onset of compression is a quite a bit at low frequencies.
Good work in quantifying the differences!
Art
Beaten into submission by reasoning and logic! Love it Art! Thanks for the correction.Just a +5dB increase sounds "twice as loud" at 30Hz..
Now I remember reading how below 20 hertz even 1 db can make quite the difference. Thanks for the smack on the forehead.
Mark
At some point in the future, I would like to open the discussion for the case of L-shaped ports, and non-round, oval or eliptical profiles: how to translate the insights collected in the spreadsheet to these designs?
Small, commercial speakers often use L-shaped ports due to low tuning, small enclosure designs, and being back in Europe with relatively small urban living spaces (compared to the U.S.,) I think this sort of port application is very useful.
Thanks for the great effort so far! The experimental part was so nice to follow.
Thanks sheeple!The experimental part was so nice to follow
Tenson posted results of an L-shaped in this thread some time ago. There was an additional resonance, reflected iff the bend, otherwise these ports ehaved well, if I remember correctly.L-shaped ports
I did measure a slot port with very similar cross section surfaces as a round port. The results for chuffing and resonance were very similar, with a tendency of very flat slot port to start chuffing a bit earlier:non-round, oval or eliptical profiles
https://www.diyaudio.com/community/...rbers-and-port-geometries.388264/post-7607675
I think an elliptical port will behave just as well as a round one, if there are roundovers at the ends.
Using an optimized port with narrow central section should allow making the port quite short. I suppose an eventual bend should have a big bend radius and eventually a larger cross section to avoid losses.L-shaped ports due to low tuning
Tenson posted results of an L-shaped in this thread some time ago. There was an additional resonance, reflected iff the bend, otherwise these ports ehaved well, if I remember correctly.
Done a couple of them. Performance wise, I never encountered any drawbacks - which is kind of counterintuitive, because you'd assume the bend would introduce resistance.
As for port compression, from practice, I can contribute that for me, no amount of compression is acceptable. Even a measured compression of just around 1 dB already sounds compromised imo. You just notice the playback is not as effortless.
Here is an even better comparison between round and slot port:non-round
https://www.diyaudio.com/community/...rbers-and-port-geometries.388264/post-7627308
Remember me? 😛
I got a bit stuck with the port model last year.
I think I had too many measurements taken in different conditions, and there was too much guesswork. I couldn't make more measurements at the time, the measurements I had were hard to compare and other things got in between.
One problem was that I could not separate port compression and thermal compression.
I tested this subwoofer again (38,5 Hz tuning, 296 mm2 ports) with CEA-2010 bursts instead of sine sweeps.
Comparing 120 V and 5.66V at 38.5 Hz I got 1 dB compression using CEA-2010 bursts, and 1.6 dB compression using sine sweeps (35.6 m/s simulated velocity), the difference is probably due to thermal compression.
I have also seen a tendency that ports might have different baseline efficiency. I went through my measurements from last year, and I had some measurements of the "new" port before adding the flares. It seems like the port actually had slightly less compression without the flare. However the flared port still "won" at high levels, but the advantage was already present at 5.66V. It did not seem like this was attributable to a change in tuning frequency, because there was no corresponding increase in midband sensitivity. I'm not sure about this, but I'd like to investigate further.
I am thinking of building a test box for testing different ports. If I use the 15TBW100 driver, CEA-2010 bursts and ports that are too small for the driver, I should be able to remove most of the influence from power compression. However, I don't have a 3D-printer. I can probably make rectangular ports with different profiles and straight sides, however the round ones would be a bit of a challenge...
I've skimmed through the thread... might have missed something...
- Home
- Loudspeakers
- Multi-Way
- Investigating port resonance absorbers and port geometries