First optimizer port test
I tested the Subwoofer shown previously:

It's an old sony 8" woofer mounted in a big 50 liter enclosure with a port dimensioned with the optimizer spreadsheet for a tuning of 37 Hz.
I tested it without and with filling in the form of a cheap ikea polyester cushion:


before showing the graphs an interesting observation:
when simulating the enclosure in hornresp (with a corresponding straigth tube port in a simple bass reflex chamber), we can see that the tuning frequency does not exactly correspond to the port output peak. The combined output has a "local peak" at the tuning frequency.
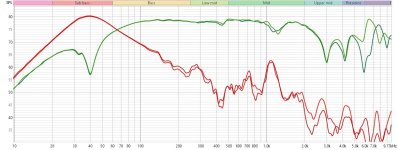
FIrst the undampened enclosure measured and simulated:


the first enclosure resonance at just below 300 Hz is quite similar. further resonances are slightly off. I suppose my enclosure cannot exactly be modeled in hornresp. the 880 Hz peak is the port resonance, not very prominent in the simulation - not sure why this is so.
the helmholtz tuning corresponds very well, as far as I see for now, see impedance valley bottom.
the wiggles between 60 and 100 Hz are room modes. those disappeared in the next measurements, where I lifted and moved the speaker to the room center.
the port and the driver are quite near so there is quite some bleed form one to the other in the measurements.
Dampened enclosure:


The enclosure resonances are almost gone. the port resonance is still there, of course.
please note that the absolute levels of the measurements are not exactly comparable, the mic distance changed slightly between the measurements!
I also tried to get the port to start chuffing or blowing, but no chance - the driver starts to distort very badly and is probably compressing heavily at 20 V input, corresponding to an estimated SPL of 94 dB/1m (4pi) or 100 dB/1m (2pi) as simulated in hornresp above. The port is still working perfectly.
More measurements will follow, but for today I am quite happy how this turned out.
Last edited:

Some more measurements of my sub
I removed the IKEA pillow from the enclosure to maximize the bass output and to make Qb as high as possible to reduce driver excursion for the high output measurements.
Here is a comparison of impedance with and without pillow:

with pillow: peaks and valley are less pronounced (lower Qb) and tuning is slightly lower. No enclosure resonance peak at 270 Hz.
And the response measured with "klippel-method" between driver and port output, position arranged to get the deepest null at low frequencies.

I also included a measurment with series cap that evens out the low end response for a 5th order bass reflex tuning.
This works quite well with a rather high Qts driver in a big enclosure. Group delay will increase due to steep roll-off.
I just used two polarized 3,9 mF electrolytics in series (minus-leads connected).
I'm not exactly sure whether the increased output of the bare "non-pillar" version between 100 and 250 Hz might just be a measurement artefact due to eventual inaccurate mic placement.
The measurements are not normalized to 2,83 V and 1 m.
I did make an estimation for correct sensitivity, using a far-field measurement at 50 cm distance and a baffle-step-corrected near field measurement. The sensitivity at the 37 Hz tuning would be 82 dB at 2,83 V and 4pi space.
Using this estimation I could check for the absoute SPL compression and H3/THD behaviour:

The measurement was done using rms Voltages from 0,25 V to 22,3 V.
22,3 V is already at the thermal limit of the voice coil.
The compression and distorsion is obviously not only related to the port design, but also very much to the driver.
The port I built was designed using my port optimizer tool for 50 litres tuned to 37 Hz and SPLmax of 90 dB (that is: at 90 dB the port will only compress about 1 dB).
As the digram shows, the compression is only about 0,5 dB at 90 dB (that is actual output, so ideal output would have been 90,5 dB).
The increase of THD and H3 is mostly related to the driver exceeding Xmax.
The chuffing spectrum for 22,3 V shows no turbulent noise, maybe just a hint of port length resonace around 800 Hz:

I plan to make one or two smaller ports to better test for the turbulent compression behaviour.
The measuements results above make it difficult to distinguish driver compression from port compression.
In any case the tuning accuracy of the port optimizer tool seems to be very good.
The dimensioning of ports for max SPL is maybe a bit too conservative and it might be possible to reduce the port sizes compared to the optimizer results.
I will post updates whenever they are ready!
I just started reading the thread and need to say:
Absolutely insane work that's been done here!
Thanks for spending the time documenting all of it, absolutely worth the read!
Absolutely insane work that's been done here!
Thanks for spending the time documenting all of it, absolutely worth the read!
I don't think this statement (well, thought rather) is quite correct, or at least incomplete.the first enclosure resonance at just below 300 Hz is quite similar. further resonances are slightly off. I suppose my enclosure cannot exactly be modeled in hornresp.
This has mostly to do with how we want to define "exactly modeled".
In fact, I find it extremely close, all things considered.
Because, one of the hardest things to model, are material properties.
Which, especially at higher frequencies will have an impact.
At this point we're most definitely going into non-linear acoustics territory.
Plain math (where hornresp is based on), won't work anymore, FEM/BEM methods will barely work.
And IF they work, they only work well when it's combined with A LOT of experimental data.
Als the stiffness will be at play here.
Btw, I would highly recommend using something else than ikea polyester cushions.
Even rockwool etc will behave much better.
I understand that this is what you probably had on hand, but for the future I would recommend materials that are more known and consistent.
Nice effort btw!
There aren't many people comparing simulations with actual real results (incl those who should)
Regarding IKEA pillow versus Mineral wool.
Polyester stuffing is a rather narrow band absorber. Mineral wool is a very wide band absorber. There would be a difference between the two measurements. Polyester is easy to use, and as in all things audio copied by everyone. If X does it, why not? I don't use it because I find it ineffective.
Polyester stuffing is a rather narrow band absorber. Mineral wool is a very wide band absorber. There would be a difference between the two measurements. Polyester is easy to use, and as in all things audio copied by everyone. If X does it, why not? I don't use it because I find it ineffective.
Yes, the point is, we don't exactly know what Ikea is using.Polyester stuffing is a rather narrow band absorber. Mineral wool is a very wide band absorber.
Rockwool was just one of the many examples.
Just pick something that is predictable.
Okay, I've been goofing around with a subwoofer design/build. I don't have a 3D printer. So I've been playing in plywood and Bondo (probably not enough Bondo). I've attached a couple of pictures. This isn't a constant radius flair partly because it is a slot. I've tried to approximate the area to some degree to see if that's close enough using straight edges. So far, no good. And, in fact, what is shown in the pictures is quite a bit worse (more sensitive to port noise) than a standard slot port.
The box itself is smaller than what the driver really wants (for reasons). I've been fighting port noise with a different version of this box using a standard slot port design. The box itself is small enough that I have to have a bend to fit the port length.
One thing I'm trying to understand is the relationship between the port and the spl target for the port. The currently designed box puts more emphasis on the port and the frequency band where the port is working compared to the driver itself (maybe that's why it is so sensitive to port noise). But changing the spl target in the spreadsheet results in drastically different ports.
At the goal spl (around 113db), the port length is 17.1 inches. If the goal spl were just 100db, the port lenght is only 10.7 inches. Or, keeping the port length the same, the port tuning goes from 33Hz (at 17.1 inches and 113db) to 18Hz (at 10.7 inches and 100db). This just doesn't seem right to me. I've not yet personally run sweeps to understand/characterzie compression, but plots I've seen with ported boxes don't have drastically shifting port tuning as they crank up the power (from 1w to 1000w). I feel like I'm missing something.
I am going to keep playing with the current port. I've got some plans for more Bondo and more smoothing.
Any help would be really appreciated.
Port tuning always relates to a port surface/port length ratio (simplified). Or in other words: exposed surface/port air weigth ratio.Or, keeping the port length the same, the port tuning goes from 33Hz (at 17.1 inches and 113db) to 18Hz (at 10.7 inches and 100db). This just doesn't seem right to me.
There is no fixed port length related to a tuning frequency.
I am not sure if you are referring to port optimizer spreadsheet results here?
And, for a target SPL of 113 dB the port needs to be huge, even more so for a low tuning!
Did you smoothen the bend edges?
Did you consider adding more flange (also on the sides) to the inside end?
Port tuning always relates to a port surface/port length ratio (simplified). Or in other words: exposed surface/port air weigth ratio.
There is no fixed port length related to a tuning frequency.
I am not sure if you are referring to port optimizer spreadsheet results here?
And, for a target SPL of 113 dB the port needs to be huge, even more so for a low tuning!
Did you smoothen the bend edges?
Did you consider adding more flange (also on the sides) to the inside end?
I am referring to the port optimizer spreadsheet.
I guess I'm just trying to think backward here. If at 113db and 33Hz the port is 17.4" long, and has exit and minimum diameters of 6.29 and 4.19" respectively, but the port at 100db would need to be only 10.26" long and have diameters of 4.53 and 3.02", then that is a drastically different port. From the thinking backward perspective, if I played the long port at lower input level what would that do to the tuning of the port? If I plug in 20Hz and 100db then I get similar'ish dimension as at 113db and 33Hz.
The challenge that I see, is that we don't see standard slot ports changing their response that drastically (from 20Hz to 33Hz, as an example) when people plot compression plots. The frequency response (at least of the total system and maybe that's where I'm messing up), stays the same (at least up until compression).
I did smooth the bend edges but think I could do a bit more smoothing and rounding. I have ideas on adding more flange on the inside end. This will likely be slow roll for me getting this done though.
I really appreciate the reply and the work that you've put into this.
Nothing. Lower level will not change the tuning.From the thinking backward perspective, if I played the long port at lower input level what would that do to the tuning of the port?
Once the air flow in the port becomes turbulent at high levels there will be audible noise and the flow disruption will lower the apparent air weight in motion and thus the resulting tuning will get higher and strong compression sets in for low frequencies.
With the port optimizer you can create a port geometry that avoids this up to the desired output level.
Conversely to the general consensus I don't think air speed is a useful parameter for the SPL limit of ports. Instead it is the strouhal number and that is related to the air displacement and thus to the frequency. This is why lower tuned ports need to be (much) bigger.
Have a look at this post (and follow up here) for overview all my measurements that confirm this.
I am convinced that many commercial loudspeakers have rather small ports and suffer from chuffing and compression at just slightly elevated levels. For some people the chuffing noise is a "desirable" sign of "strong bass". The other group of people dismiss bass reflex speakers entirelly.
As a rather good speaker and port example have a look at this test by erin: https://www.erinsaudiocorner.com/loudspeakers/sonus_faber_sonetto_ii_g2/
The speaker is tuned to 40 Hz, see impedance plot.
The compression plot reveals compression of near 1 dB for SPL of 96 dB and above 1.5 dB compression at 102 dB.
This is not a bad speaker, by any means. The port is just not designed for high levels (and the speaker is small anyway!).
For a comparison of a slot and round port with same cross section areas have a look here and here and here.
Last edited:
I should have specified: this refers to 40 Hz (port output).The compression plot reveals compression of near 1 dB for SPL of 96 dB and above 1.5 dB compression at 102 dB.
Thank you everyone who is participating in this, for your time and effort. I didn’t read the whole thread, but I hope I did everything correct.
Fb 43 Hz, Vb 17.3 liters, SPLmax 90 dB/m. A guy from Facebook Marketplace printed two pieces for 25 Euro. I used the 3D model from this thread - thank you!
The opening was printed a bit messy, so I removed a layer on a lathe. Seems like I took off too much, and the port broke when I was bolting it. Also, I didn’t drill the holes for port in the cabinet very precisely - that might have played some role in this failure. Glued it with some kind of poly glue.
Attachments
-
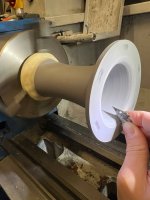 photo_2025-05-28_16-09-18.jpg146.1 KB · Views: 72
 -
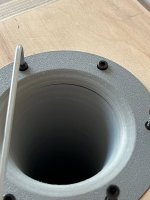 photo_2025-05-28_16-09-28.jpg144.9 KB · Views: 74
 -
 photo_2025-05-28_16-09-22.jpg186.5 KB · Views: 80
 -
 custom port vs 3d port (1).jpg127.2 KB · Views: 76
 -
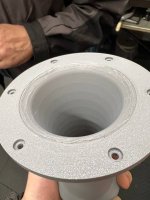 photo_2025-05-28_16-09-20.jpg124.6 KB · Views: 70
 -
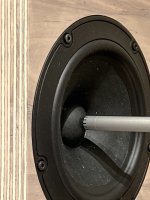 photo_2025-05-28_16-09-31.jpg107.8 KB · Views: 72
 -
 photo_2025-05-28_16-09-32.jpg80.2 KB · Views: 77
 -
 R port distortion near-field.jpg138.4 KB · Views: 72
 -
 R driver distortion near-field.jpg123.9 KB · Views: 62
 -
 L+R port and driver near-field measurment.jpg113.4 KB · Views: 79
Make sure you paint the port. HD and chuffing are definitely caused by a rough surface.
I will shortly post new measurements of a slightly smaller port, better showing port compression behaviour.
But first, my more refined observation:
In addition: the strouhal number (port radius/air particle displacement) has a minimum just below the port output maximum.
So, a port may be fine at the exact enclosure tuning frequency, but it will be turbulent slightly below tuning.
This effect is probably most pronounced with high port output, tuned low and steep rolloff systems, such as my test subwoofer. It will be more benign with more common bass reflex systems with more commonly tuned less peaky port output.
My next measurement results will show this.
But first, my more refined observation:
The port output peak slightly below tuning also relates to turbulent chuffing and compression behaviour of ports, of course.before showing the graphs an interesting observation:
when simulating the enclosure in hornresp (with a corresponding straigth tube port in a simple bass reflex chamber), we can see that the tuning frequency does not exactly correspond to the port output peak. The combined output has a "local peak" at the tuning frequency.
In addition: the strouhal number (port radius/air particle displacement) has a minimum just below the port output maximum.
So, a port may be fine at the exact enclosure tuning frequency, but it will be turbulent slightly below tuning.
This effect is probably most pronounced with high port output, tuned low and steep rolloff systems, such as my test subwoofer. It will be more benign with more common bass reflex systems with more commonly tuned less peaky port output.
My next measurement results will show this.
Last edited:
Bass reflex tuning frequency, port output peak frequency, maximum port airspeed (=strouhal minimum) frequency
1) Low Qts driver:
I used a properly suited driver for bass reflex (Qts = 0,31) as a first example:
Hornresp Simulation:


Tuning was set to 50 Hz using the loudspeaker wizard in hornresp.
The impedance minimum, the port output peak and the driver output notch correspond quite well, just below 50 Hz.
The driver excursion and port air speed maximum are at lower frequency.
Port exit air velocity / strouhal number graph from the loudspeaker wizard:

As to be expected, there is a (local) strouhal minimum at port air velocity maximum.
For lower frequencies the strouhal number is neglible, because the output is very low.
I would have to do another investigation wether any low frequency port noises are disturbing or not ...
Measurement:

Unfortunately I just have impedance and port output measurment for this speaker.
The Impedance looks slightly different from the simulation, left peak is lower, indicating a lower than "textbook" tuning as shown in simulation - that might be sign of a lousy TSP measurement. 😳
Impedance miminum frequency just slightly higher than the port output peak frequency.
2) High Qts driver with low tuning:
This is the subwoofer as shown above, just using a smaller port.
the smaller port will be used to measure turbulent air compression (post will follow!).
This is a rather high Qts driver (0,65) used in a large enclosure and tuned low.
The resulting ripple at lower end will be "equalized" using a large series cap, thus leading to a 5th order system (not shown here).
Hornresp simulation:


The bass reflex tuning was set to 37,2 Hz.
Impedance minimum corresponds to this frequency.
Port output peak is much more pointed than in the example above and at around 33 Hz, quite a bit lower than the tuning.

Diaphragm displacement minimum is more or less at tuning frequency and corresponds to impedance minimum.


port air velocity maximum and strouhal number minimum are near the port output peak frequency, at 33 Hz - below tuning.
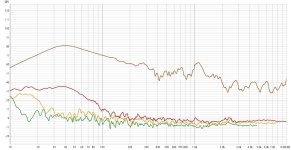
Measurement (including simulation of port and driver response):

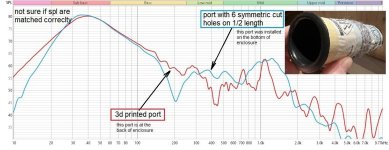
Impedance minimum indicates a correct tuning - the port optimizer set to 37 Hz and 3d-printing of the resulting geometry port seems to work fine!
Port output corresponds very well to the hornresp simulation (including the first enclosure resonances).
The driver output however has some deviations: measured driver minimum is very close to port peak, but simulation would suggest a slightly higher frequency.
Influence of impedance measurement series resistor
During these measurements I also remembered that using a series resistor for impedance measurement (8 ohm in my case) will change the driver parameters and thus, may influence the tuning.
I did some hornresp simulations including a series resistance in the filter wizard.
This had severe influence on the response, of course, but the tuning (impedance minimum frequency) seemed to remain unaffected.
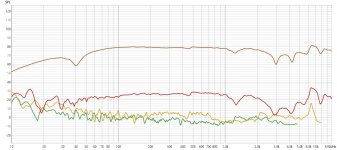
So I did response measurements, with and without the series resistor:

(Impedance measurement was done with the series measurement resistor, of course!)
Without series resistor the port peak and the driver notch are at similar frequency.
Including the series resistor makes the port output even more pointed and lower in frequency.
The driver output notch however is slightly higher in frequency with the series resistor!
conclusions:
Using the impedance minimum as reference for bass reflex tuning seems (of course) sensible.Measuring impedance with a medium to high resistor might change the shape of the impedance graph but does not seem to affect the tuning (= frequency of impedance minimum). Further investigations with lower series resistor for measuring might make sense.
Any port compression measurement should be done at the port output peak and/or slightly below. this is where the most unfavorable (high) air particle displacement (and thus: lowest strouhal number) happens.
And last but not least: importance of exact bass reflex tuning should not be overrated.
I realized this once more, when doing low frequency sweeps: The influence of speaker placement and listening spot location in a room makes any tuning difference meaningless. Even more with one single subwoofer...
Last edited:
@stv
interesting to read that port tuning is not that important.
I measured several times very broadband output at the reflex port or passive radiator.
For not unloading the driver I tune it as low as possible near 25 or 30hz and try to use big reflex diameters. At least 8cm.
With additional close to back wall or even corner loading I always get impressive results.
What close to room boundary positioning of a loudspeaker/subwoofer does I tried to find out by searching for measured data.
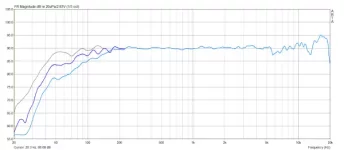
Looking further for someone who really did do measurements
https://www.jobst-audio.de/artikel/messtechnik-entwicklung/groundplane-nahfeld
light blue is fullspace
dark blue is halfspace
grey is quarter space
not measured is corner placement
Here what he wrote in german:
Hier sehen wir eine 2-Wege-Box im Vollraum (Hellblau),
im Halbraum (Blau) und im Viertelraum (Grau) - (Letzteres leicht unsauber gemessen, aber zur Veranschaulichung tut's das).
Wir erkennen ab wann es die +6dB gibt und bis zu welcher Frequenz hin wir Pegelzuwachs erhalten.
Die Schallwand entspricht hier...
Attachments
... that's just my personal view 🙂interesting to read that port tuning is not that important.
And it's just referring to the precise decimal digit tweaking, using simulators.
Correct and sensible tuning is important!
But it's usually not that important to simulate a perfectly flat alignment because it will never be like that in s room.
Thanks for the linked posting, interesting!
I suppose the graph you posted is a groundplane measurement, not (very much) influenced by room modes?
I will do some ungated farfield measurements at different locations in my "measurement room" to see how much the response changes.
Last edited:
@stv
I had good experience with corner placement and had in mind what was often said about it, that it will sound muddy or bad and the like so I wanted to check.
The web ist still full of comments like "never place your sub in the corner" I was astonished like this was something everyone would automatically agree on who is into hifi or high end.
The measurement from Jobst Audio I think is a ground plane measurement one. However you can reread it on the webseite.
I was looking for someone who did the job showing one box and what the different positions would do to the frequency response and found up to two room boundaries, still the last one - corner placement is missing.
For me the measurements show no "bump" or "buckling" frequency response but every room boundary seems to make a subwoofer sing lower than before.
At the same time, not measuring the actual T/S parameters of the driver.And it's just referring to the precise decimal digit tweaking, using simulators.
Go figure LOL 😀 😀 😀
- Home
- Loudspeakers
- Multi-Way
- Investigating port resonance absorbers and port geometries