8 ohm @ 20 kHz speaker must be a rare thing.
Only taken from the Java example!!
If I understand it right, if the impedance is higher, lower loss. Correct?
Electrostat is another thing, but even so, can you hear these small differences at 20 or dare I say 10khz? Wearing my fluffiest slippers in this thread😉
Peter
Last I checked this old man was still good to about 15 kHz, but with this flu season....
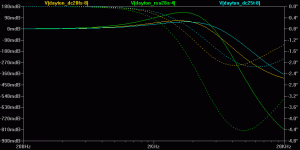
I would expect these two inductances in series to show a shelving response but have no intuitive sense of the frequency at which that transition would occur with these devices.
I would expect these two inductances in series to show a shelving response but have no intuitive sense of the frequency at which that transition would occur with these devices.
Has anyone examined its effect against the inductance typical of the high frequency behaviour of the vast majority of consumer loudspeakers? Or the capacitance of a stat? The truly non-reactive, 8 ohm @ 20 kHz speaker must be a rare thing.
Most speakers are inductive at 20kHz, which makes the inductance of the cable even less significant than for the well-Zobeled tweeter you identified. Didn't I make that point rather strongly about 300 pages ago?😀
Last I checked this old man was still good to about 15 kHz, but with this flu season....
Yupp, that's were I am also for the moment, both 15 khz(maybe a bit under) and flu for three weeks..
Otherwise I'm extremely sensitive for changes of the tone created by the other half. And were not talking about decibel here. Can anyone explain this phenomenon in an scientifical way

Survival instinct comes to mind...
Peter
I would expect these two inductances in series to show a shelving response but have no intuitive sense of the frequency at which that transition would occur with these devices.
It's an easy problem. You have a voltage divider with the upper arm looking like 3 milliohms and (if you're nutty enough to space your wires 50cm apart) 5uH. The lower arm will typically look like 5 ohms in series with 25uH (taking a typical value for a dome tweeter). I think you can do the RMS sums.
While you're punching keys, try using a realistic inductance and series resistance value for 12 gauge zip cord. This is so far into insignificance, you might as well worry about the north-south alignment.
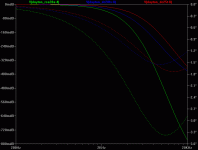
Oh you wacky hair-shirt guys, when Spice is a free download and doesn't require a slide rule? Results for three Dayton tweeters, because they're popular and well documented. One 4-ohm model for excitement. Speaker cable resistance and amp damping factor ignored as scaling factors moving the curves and down uniformly. Of course, this is only applicable to bi/tri-amp devotees.
Attachments
Last edited:
Oh you wacky hair-shirt guys, when Spice is a free download and doesn't require a slide rule? Results for three Dayton tweeters, because they're popular and well documented.
Hey, I'm old school. I figure this stuff out with pencil and paper.
Now, since you have your Spice box out, try inserting the parameters for 4 meters of good old 12AWG zipcord (which is a far less oddball approach than 50cm spacing). 1.5uH, 26m ohm. Noting, of course, that even the Crazy Eddie approach doesn't show anything significant.
Real Men do long division.
Thanks, that corresponds pretty well to my guesstimate, i.e., 67% of ****-all, as Tim de Paravicini would say.
Thanks, that corresponds pretty well to my guesstimate, i.e., 67% of ****-all, as Tim de Paravicini would say.
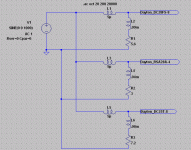
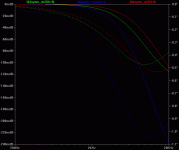
For final fun, here are the same tweeters driven by the pathological cable but this time first-order crossed over with a single cap, looking at voltage at the crossover input. Now the speaker cable interacts with the complex driver/cap impedance. Note the obvious bump at the crossover frequency and keep in mind this appears, within the limits of the other driver impedance, across all the drivers.
Attachments
Nice one, rdf. So with the pathological wire, we have 0.1dB, edging toward barely audible. And I mean "barely." EQ via wire. With zip cord, the relative deviation should work the same way as before, i.e, dropping the EQ by about half?
Nice one, rdf. So with the pathological wire, we have 0.1dB, edging toward barely audible. And I mean "barely." EQ via wire. With zip cord, the relative deviation should work the same way as before, i.e, dropping the EQ by about half?
How do you measure transparency and sound staging with a meter? Just curious. Never heard of a measurement for those traits yet. Ears are the only way that I know to tell the difference with regards to those traits. Just curious how these are measured.
Can you explain what this means and where that number comes from?
Testing the frequency response and harmonic distortion of different sound cards with RightMark and several people showed, that while RightMark was "pointing in the right direction" the extent/amount of any error was never perceived in proportion to the figures shown on screen.
That accounts for the 0.12db figure to error out of favor with the ear, and while this figure is approximate, it also demonstrates the very small tolerance for "wrong sounding" errors. Its much smaller than previously anticipated. Hyper-sensitive equipment and picky people were, perhaps, contributing factors to this figure. I think that it is suited to the hi-fi market.
The 40db figure, to error in favor of the ear comes from standard audiology tables, and it is an approximate figure. The actual figure varies depending on the sound pressure levels in use as well as the frequencies where the error occurs. This figure given was arbitrarily conservative, because the actual figure might be overkill for the hi-fi market. Audiology is a great way to determine the least intrusive crossover frequencies for a multi-way speaker's crossover, and I cite this precedent for the use of audiology in audio equipment measuring.
Perhaps someday, measuring equipment can have an option where it displays on a graph what a person may hear. However, a flat response isn't always going to apply to audio because the ear never has a flat response.
You can see why the proportion of error perceived turned out much differently than the measurements indicated.
Of course, much of the ear favoring has already been created in the recording studio. Even though the recording studios do quite a bit of accommodation. . . according to the science of audiology there remains a generous budget to error in favor with the ear (the cases where imperfection is just fine); however, it is also true that there's an extremely tiny margin for errors out of favor with the ear (the cases where imperfection is intolerable).
Bearing in mind that the purpose is audio, as in ear is part of it, this may help explain why some large errors are tolerable while other, tiny errors, are intolerable.
Any software engineers out there willing to arrange for a "what you hear" adaptation on a far field measure?
Testing the frequency response and harmonic distortion of different sound cards with RightMark and several people showed, that while RightMark was "pointing in the right direction" the extent/amount of any error was never perceived in proportion to the figures shown on screen.
That accounts for the 0.12db figure to error out of favor with the ear, and while this figure is approximate, it also demonstrates the very small tolerance for "wrong sounding" errors. Its much smaller than previously anticipated. Hyper-sensitive equipment and picky people were, perhaps, contributing factors to this figure. I think that it is suited to the hi-fi market.
I still have no idea what this means. Is there a reference somewhere written a bit more clearly?
How do you measure transparency and sound staging with a meter? Just curious. Never heard of a measurement for those traits yet. Ears are the only way that I know to tell the difference with regards to those traits. Just curious how these are measured.
When someone actually demonstrates differences in soundstaging or transparency from wire, detectable by ear alone (no peeking), get back to me with that question.
Nice one, rdf. So with the pathological wire, we have 0.1dB, edging toward barely audible.
More like a half dB over a couple octaves. No claim of smoking guns, I've just hated simplifying assumptions since my EE profs instructed to get within a factor of ten and finalize on the bench. Into a low impedance, high order multi-way the RLC of the ubiquitous 16 gauge recommendation could reach audibility on complex impedance alone, without the help of magic and the spirit world. That last post was to suggest it's worth a look.
Edit: it occurs to me now I first simulated this on punch cards!
More like a half dB over a couple octaves.
??? 100mdb= .1db
it occurs to me now I first simulated this on punch cards!
Your as old as I am. Fortran
How do you measure transparency and sound staging with a meter?
You don't. That isn't even the point to all of the measuring. Our beloved hobby is a mirage, an insultingly good illusion of something that was once real. These hair shirt fellows are just going about doing their job, which is to make sure that the equipment they devise is the best they can. In so doing, they allow the rest of us, in our Hawaiian shirts, to sip mint tea and discuss the illusion as if it were anything but. That we have an illusion at all is entirely due to the careful, step by step analysis of the best methods available, to provide the most information possible, correctly. If they hadn't been progressing in the correct direction all this time, our illusions would not have progressed to the state they have.
If you take a look at the odd ideas I have been promoting over the last two years, you will note, eventually, that I continually invite the hair shirted folks to engage with the possibility that I am pointing to yet another level of performance, beyond where they knew they were safe. This does cause alarm, and gallons of placebo water are dumped on to neutralize the snake oil they fear I am pointing to.
In a few years we will find them happily tearing out the old and soldering in the new and we will all benefit. Not from my ideas, or their implementation, but from the careful and measured exploration of the new horizon they must trek to.
Just enjoy the benefits already pouring from your speakers. And, get ready to experience yet another revolution in our illusions, it is happening right now and to a degree, right here.
Bud
Peaks a little over 100 mdB at 3kHz, down around 400 mdB by 6 kHz, so I was in error. Around half a dB in a single octave. Almost 1 dB down in two, not that I put much weight is such a simplistic analysis.
OT: First computer used was an IBM 1130. Me and that Geico guy.
OT: First computer used was an IBM 1130. Me and that Geico guy.
- Status
- Not open for further replies.
- Home
- Design & Build
- Parts
- I don't believe cables make a difference, any input?