jhstewart9,
Thanks for the interesting article, 2A3 & 45 in Push Pull. I would never have thought of that.
I am always interested in different descriptions of implications and effects of matched and un-matched tubes.
I do have a mean streak in me; just a little short of Bi-polar. It comes out too often.
I apologize for that.
I have to apologize to everyone.
Part of my mistakes in writing/posting is that I am a terrible proof-reader of my own writings and postings.
And in my mind, "I am always right". I wish it could be so. I am human.
But I do have a skill from years of reading draft data sheets and other Marketing blab.
The nice marketing lady, Tamara, would bring me a draft document. Before the ink dried, and long before I even read the whole document, my eyes would fixate on the one and only error in the document.
Well, I did quickly fixate on an error again, sorry.
The article correctly listed the mu of the 2A3 and the 45 (4.2 and 3.5 respectively).
But then it made the mistake of saying that those were within 12% of each other.
4.2 / 3.5 = 1.2 which is 20%.
To this day, I do not know how I find those mistakes so quickly.
A blessing?
I pray everybody has a good weekend, and happy building and happy listening.
Last edited:
TonyTecson,
you should be aiming to recognizably reproduce the spectral distortion of musical instruments.
yes...
This $20,000 amp would sound awesome with one of those $14,000 power cords, so it has cleaner electricity. And the $1,000 little wooden stands that hold your speaker wires off the floor.
Some 2-Tone Examples Using 3,4 Method
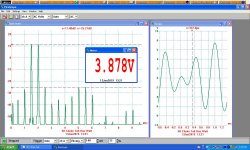
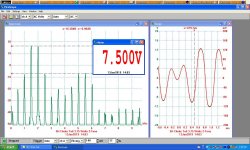
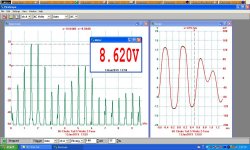
These IMD tests were done on the Self Inverting PP 6V6 Test Mule using the 3,4 Frequency Test Method proposed by Graeme Cohen. His paper included here. The IMD products increase quickly as the power level is increased. Percentages to the 3-order products are 1.45% at One Watt, 6.85% at 3.75 Watts & 11.72% at 5 watts. Test frequencies are 1.5 KHz & 2 KHz.🙂
These IMD tests were done on the Self Inverting PP 6V6 Test Mule using the 3,4 Frequency Test Method proposed by Graeme Cohen. His paper included here. The IMD products increase quickly as the power level is increased. Percentages to the 3-order products are 1.45% at One Watt, 6.85% at 3.75 Watts & 11.72% at 5 watts. Test frequencies are 1.5 KHz & 2 KHz.🙂
Attachments
jhstewart9,
Thanks for the plots.
It shows me that I need to check not just the IM; but also the 2nd harmonics of the two original tones and the IM products that are on them.
One problem to test that, is the only clean two tones for 3rd order tests I have are at 11kHz and 12kHz.
That puts the 2nd harmonics up at 22kHz and 24kHz By that time, most of my amplifiers are already down at -1dB.
That is OK for my ears and speakers, but it does skew the test results.
And of course, I can also see the 1kHz 2nd order IM that is created too.
The only other clean two tones I have are for the Low frequency / High frequency 4:1 power ratio 2nd order IM tests.
I used to do channel bandwidth, adjacent channel power, and alternate channel power spectral measurements on cellular digital modulation signals.
And I did the EVM measurements too, before the amplifier manufacturers were asking to do that measurement too (more expensive analyzer that they could not justify).
But the Cellular system designers knew that the modulator EVM and Amplifier together created EVMs that were a problem, even if the channel bandwidth, adjacent, and alternate spectrums were OK.
Soon, the amplifier manufacturers were asking us for analyzers to be able to do EVM measurements to keep the system designers happy.
From that experience, I always wanted to create a digitally modulated signal, with the "carrier" at say 4kHz, and a channel bandwidth of say 1 kHz, and then do the same kind of test on an audio amplifier.
I just do not have the time, energy, or parts to built such a signal source.
The only other way know how to do this, I got the idea from the Microwave boys at Bell Labs.
The 4kHz wide channels that were stacked onto the FM modulator of a microwave link.
They would pull one 4kHz channel out at the transmitter, and then measure what came out of the same tone pack at the receiver (the spectrum filled in some from the intermods of the transmitters amplifiers adjacent channels.
From this Bell Labs test, I got the idea to use an audio white noise signal source, and filter everything below 3.5kHz, and everything above 4.5kHz.
Then go look for the 2nd order and 3rd order IM that fill in the low frequency up to 1kHz, and also on either side of the high frequency "channel".
Tubelab_com, are you reading this?
Is this a valid test of an amplifier IM distortion?
Last edited:
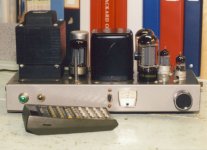
This amp & another identical were built circa 1960 & used until 1977. Still on the shelf, the coupling caps replaced a few years ago. So this test was done in 2019, still looks good. All the IMD products are down more than 40 db ,<1% dist. 15.8 watts measured by a MetraWatt 29S Precision DVM & Wattmeter..🙂
Attachments

jhstewart9,
Thanks for the plots.
It shows me that I need to check not just the IM; but also the 2nd harmonics of the two original tones and the IM products that are on them.
One problem to test that, is the only clean two tones for 3rd order tests I have are at 11kHz and 12kHz.
That puts the 2nd harmonics up at 22kHz and 24kHz By that time, most of my amplifiers are already down at -1dB.
That is OK for my ears and speakers, but it does skew the test results.
And of course, I can also see the 1kHz 2nd order IM that is created too.
The only other clean two tones I have are for the Low frequency / High frequency 4:1 power ratio 2nd order IM tests.
I used to do channel bandwidth, adjacent channel power, and alternate channel power spectral measurements on cellular digital modulation signals.
And I did the EVM measurements too, before the amplifier manufacturers were asking to do that measurement too (more expensive analyzer that they could not justify).
But the Cellular system designers knew that the modulator EVM and Amplifier together created EVMs that were a problem, even if the channel bandwidth, adjacent, and alternate spectrums were OK.
Soon, the amplifier manufacturers were asking us for analyzers to be able to do EVM measurements to keep the system designers happy.
From that experience, I always wanted to create a digitally modulated signal, with the "carrier" at say 4kHz, and a channel bandwidth of say 1 kHz, and then do the same kind of test on an audio amplifier.
I just do not have the time, energy, or parts to built such a signal source.
The only other way know how to do this, I got the idea from the Microwave boys at Bell Labs.
The 4kHz wide channels that were stacked onto the FM modulator of a microwave link.
They would pull one 4kHz channel out at the transmitter, and then measure what came out of the same tone pack at the receiver (the spectrum filled in some from the intermods of the transmitters amplifiers adjacent channels.
From this Bell Labs test, I got the idea to use an audio white noise signal source, and filter everything below 3.5kHz, and everything above 4.5kHz.
Then go look for the 2nd order and 3rd order IM that fill in the low frequency up to 1kHz, and also on either side of the high frequency "channel".
Tubelab_com, are you reading this?
Is this a valid test of an amplifier IM distortion?
For those measurements required in digital modulation systems the Aeroflex 3920 does many & others by the Boonton 4500. Motorola, Kenwood & what was the Early Warning System used them locally. I got to drive a lot of these as I worked for the local rep. Check also Boonton App Note 50, a good description of digital modulation & measurements.
Attached my App note on testing SSB for Coast Guard & Airforce, they were using the IFR/Aeroflex 2975.
This Boonton is Boonton Electronics of NJ, Boonton Radio Corp (BRC) was acquired by HP in the early 60s. All great stuff, lots of sales.😀
Attachments
4-Tone Test Explained, Convex Corp
From this Bell Labs test, I got the idea to use an audio white noise signal source, and filter everything below 3.5kHz, and everything above 4.5kHz.
Then go look for the 2nd order and 3rd order IM that fill in the low frequency up to 1kHz, and also on either side of the high frequency "channel".
Convex Corp is/was a Comm Test Equipment Manufacturer at Voice Frequencies. Peak to RMS Ratio of the Test Signal is important, as are the frequencies selected for the test.
Attachments
jhstewart9,
Thanks for the information!
Reading some of that is a good reminder of terms and techniques I used to use.
It is kind of scary how much has been put out the back door of my mind.
I was hoping that someone would do the calculations for either a 64QAM or 256QAM modulation with Root Raised Cosine filtering on a 3.5kHz carrier, with a Symbol rate of 500Hz or 1kHz.
Stuff that signal onto a Red Book CD.
Test out the CD player DAC and output amplifier.
Test a vacuum tube amplifier.
I know, I ask for too much.
I can dream, can't I?
Last edited:
Probably my favorite test that I never had to do by that old test method, was the radar -3dB pulse width measurement.
Oscilloscopes back then did not work at 3.5GHz, 10GHz, etc.
And putting a sampling head scope on a US Naval ship would have been an expensive proposition.
Zaaaap! dead sampler.
Sooner or later, every new technician would forget to put an attenuator on the radar's slotted line. So much for the Bolometer head.
Zaaaap! dead bolometer head. But less expensive than a sampling head.
The -3dB pulse width used an oscilloscope, a 3 dB 50 Ohm pad, a 50 Ohm diode RF detector, and a grease pen.
A small signal pickoff was first applied to the 3 dB pad and the pad output was applied to the RF detector. The RF detector output was applied to the scope. A grease pen marked the peak output on the CRT face.
Then the 3 dB pad was removed, putting 3 dB more signal at the RF detector.
The time from when the pulse crossed over the grease line to the time the pulse
crossed under the grease line was the -3dB pulse width.
Genius rating to whoever first thought of that one.
I only made pulse width measurements on radars with a spectrum analyzer that had lots of time domain bandwidth in zero span mode.
Much easier.
But forgetting about the power level out of the radar sample port could ruin the spectrum analyzer. Zaaap!
Last edited:
See post #36. While there is musical merit to adding bulk non-linear distortion to a single instrument or note, the same can't be said for adding non-linear distortion to a finished recording of an entire ensemble as it adds too much intermodulation distortion between instruments which sounds grating.real musical instruments produce harmonics, why not amps?
do we call harmonics produced in real musical instruments distortions?
afaik, a really good amp should be able to pass all this....
It is possible using digital signal processing to add harmonic distortion without intermodulation distortion by pitch shifting the recording without changing the speed of it, then mixing it together with the original. I once tried this and a surprising amount of harmonic distortion (over 10%) could be added before an audible change was heard. The effect sounded more like a change in frequency response, than typical non-linear distortion caused by an amplifier or speaker.
Last edited:
Linear scales are irrelevant.
Measurements against linear scales are irrelevant.
The distortion of musical instruments is irrelevant.
Cochlear distortion is irrelevant.
The THD metric is irrelevant.
Only subjective evaluations are relevant.
Amen.
Measurements against linear scales are irrelevant.
The distortion of musical instruments is irrelevant.
Cochlear distortion is irrelevant.
The THD metric is irrelevant.
Only subjective evaluations are relevant.
Amen.
Linear scales are irrelevant.
Measurements against linear scales are irrelevant.
The distortion of musical instruments is irrelevant.
Cochlear distortion is irrelevant.
The THD metric is irrelevant.
Only subjective evaluations are relevant.
Amen.
I think you are 180 degrees out of phase. (That's a full scale deflection on my Cloud model 9 Subjectivity Meter)..... Omen
Last edited:
Tubelab_com, are you reading this? Is this a valid test of an amplifier IM distortion?
There are probably as many different ways to measure IMD as there are standards bodies writing specs for testing.
IMD results when more than one signal hits a nonlinear device. As I have found out, this nonlinear device can be a rusty bolt 100 feet up on a cellular tower, or the green growth on a copper ground wire. It does NOT have to be an electronic component, though for our discussion we are looking at just the IMD created inside an amplifier.
Consider the simplest case two tones (see the picture in post #86) We feed two equal strength signals into our amp, one at 1.5KHz and the other at 2 KHz. There will be first order mixing products, the sum and difference frequencies that are created by each little nonlinearity in the whole amp. These are seen at 3.5 KHz and 500 Hz. These nonlinearities also create Harmonic Distortion, harmonics of the original two tones. These are seen at 4.0 KHz, 6.0 KHz, 8.0 KHz (too low to see on this chart), 3.0 KHz, 4.5 KHz, 6.0 KHz and higher.
The harmonics will mix with the original input tones to create third order mixing products, So the 3 KHz second harmonic of the 1.5KHz tone will mix with the 2 KHz tone to create a tone at 5 KHz, and at 1 KHz. The the 4 Khz second harmonic of the 2 KHz tone will mix with the 1.5 KHz to create a tone at 5.5 KHz and at 2.5 KHz.
There will be additional 5th and 7th order order products when the device is driven harder. This is with only TWO simultaneous TONES applied to the amp. Music has many sounds at once applied at random times, levels and frequencies. It's easy to see what a mess this can create.
I used to test my LTE radio transmitters with 5 or more simultaneous RF tones, a BIG spreadsheet was needed to sort out all the possibilities.
For two way radio testing we had Electronic Industry Alliance specs that dictated EXACT specs, and methods of measurement with specific pieces of HP test equipment called out. Spec #RS204X was for the receiver a two way radio transceiver for narrow band FM use in public safety radio, and RS152X was for the transmitter. These specs evolved as technology improved, and a new one with a different letter suffix appeared every couple years. IMD performance of the RF section was clearly specified an involved stuffing three simultaneous RF carriers into the receiver to determine the levels of interference caused to the desired low level signal by the strong undesired signals. This testing has NOTHING to do with audio amplifier measurements, but they are measuring EXACTLY the same nonlinearities that are found in audio amps. The methods of testing are designed to fit the use case of the equipment, and how the impairments affect the user.
As you stated Error Vector Magnitude measured the impairments to a complex digital modulation scheme by nonlinearities in amplitude, frequency, phase, and time to a "constellation in RF space" of 16 to 256 unique modulation symbols each having a unique point in phase and amplitude modulation of an RF carrier.
I have read papers discussing the use of this technique for analysis of "audio" amplifiers, and DSP processors(baseband was 0 to 25 KHz in the early iDEN days), but never did this kind of testing since I was an RF guy.
I did have an HP89441 analyzer on my bench that cost more than my house did, but never used it for baseband EVM testing, only RF. The baseband guys used this type of equipment to analyze their "predistortion" algorithms.
Basically if you know how your equipment at each end and the RF channel will distort the signal, you can pre-distort it in the opposite direction before sending it to minimize errors at the other end. This is a common technique used in radio transmitters today.
I could see how EVM measurements could be applied to audio amps, and these 1990 vintage $50K test boxes can be found on Ebay today for $1K to $2K. Am I going down that rabbit hole? No way!
There are two common standards groups for audio amp testing, Institute of High Fidelity Manufacturers and Society of Motion Picture and Television Engineers. They both call out a similar method of measuring IMD distortion in audio amps with minor differences in the test frequencies and levels used. These subject the test amp to a pair of audio tones and measure the resulting jumble of tones after filtering out the original two tones. Today I use a PC with FFT capability for testing amps.
Many years ago I used a setup like documented in an old HP application note. They used a pair 204C audio oscillators and a pair of HP331A distortion analyzers. I put together a similar setup, but added an HP8903A (replacing one of the 331A's) when I got a dead one cheap and fixed in in the 1990's.
I use a pair of clean HP 204D oscillators with resistive summing to create two tones. I take the signal from the amplifier output and pass it through the notch filter in an old HP331A distortion analyzer to remove one of the original tones, then feed that output to my HP8903A audio analyzer which will automatically notch out the other tone. This will display the IMD distortion accurately enough to measure tube amps. It matches the PC within 0.1% down to small fractions of a %.
In theory the noise test would work, but I have never tried anything like it. I imagine that some clean test tones could be made in a PC or even with a good test CD, and the results could be viewed on a PC with an FFT test program and a good sound card.
Tubelab_com,
Thanks for your discussion.
I remember a digital modulation scheme that was designed to reduce the peak to average deviations.
64QAM, but with the 4 corner symbols missing.
What a software coding nightmare for the transmitter and for the receiver
(all software is a nightmare for me).
4 sets of 8 bits were Verboten . . . the missing corners.
For my tube amplifiers, I have to run my IMD measurements with a CD that has
250 / 8020 Hz (4:1); and 11 / 12kHz (1:1).
For my tube amplifiers, I have to run my IMD measurements with a CD that has
250 / 8020 Hz (4:1); and 11 / 12kHz (1:1).
Test equipment, both new & used has never been more affordable. And capability is much beyond what was out there 50 yrs ago. So easy to get in the game today, more than ever.😀
250 / 8020 Hz (4:1); and 11 / 12kHz (1:1).
Test equipment, both new & used has never been more affordable. And capability is much beyond what was out there 50 yrs ago. So easy to get in the game today, more than ever.😀
.... we are looking at just the IMD created inside an amplifier.
The harmonics will mix with the original input tones to create third order mixing products,
There will be additional 5th and 7th order order products when the device is driven harder. This is with only TWO simultaneous TONES applied to the amp. Music has many sounds at once applied at random times, levels and frequencies. It's easy to see what a mess this can create.
Oh my, my, my, MY! How can my simple little home made PP and SE amps sound so good with all that music going through them? I guess I've just avoided engineering malpractice and IMD testing to keep living the dream. It's better not to know, especially if there ain't nothin' anyone has ever posted about how to fix it if it's there.Just keep your stages decoupled well enough, and be happy. Keep the DIY knows better fantasies to a minimum.
I remember a digital modulation scheme that was designed to reduce the peak to average deviations.
I retired from Motorola in 2014. The high power mobile LTE program ended in 2011, after that I was working on EVB's for a next gen portable radio chip set that is now shipping.
I have some glimpses into the fun I was having. LTE was in release 7 at the time and just being rolled out for phones. We were working on data radios for cop cars with high power. The peak to avg ratio of an uncompressed LTE signal was about 10 dB. A couple dB could be gained by purposely dropping some symbols at the expense of a raised bit error floor. There were some other proprietary compression systems that may or may not have been implemented. I think LTE is on release 12 or 13 now, so a LOT has changed.
My approach was a bit different.....build a transmitter that put out 120 watts of CW at P1dB for a 10 watt average power LTE radio.....which put about 7 or 8 watts into the antenna after duplexer losses.
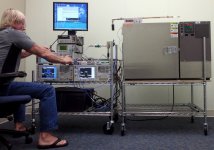
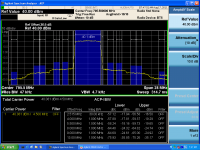
Here I am hard at work running that transmitter over temperature and load pull. The second picture shows a screen shot of an emission mask test at 40 dBm (10 watts) average power. This is a 5 MHz wide channel with power averaged over the 4.5 MHz chunk in the middle that would actually be used for data. You will note three distinct "shoulders" these are the IMD products generated from the third, fifth, and seventh order mixing products. The blue bands show where the measurements for adjacent channel power are taken and the actual measured data is presented in the table. This transmitter has about 10 db margin to spec without any predistortion or cartesian feedback applied. Building big (LDMOS) silicon for small jobs is actually cheaper and works better than throwing DSP power at a smaller power amp.
If you were to stuff band limited white noise (say an equal power "Barts Head" about 1 or 2 KHz wide centered at 5 to 7 KHz) into an audio amp with sufficient bandwidth to reproduce the third through seventh order IMD products, you should see a similar picture on a FFT analyzer.
Note that "Barts Head" was a term that we used to describe these digital modulation scheme's picture on the spectrum analyzer, due to the resemblance to Bart Simpson. I don't know how far that term propagated outside of Motorola, HP and a few other suppliers.
I guess I've just avoided engineering malpractice and IMD testing to keep living the dream. It's better not to know
We had to know, and fix. There were these impediments that go by names like FCC, DOC, and 3GPP that limit these distortions by law.
Attachments
Last edited:
- Home
- Amplifiers
- Tubes / Valves
- I choked on my cornflakes!