It would be nice to find such software but at student price, this costs 89$.
FFT properties
It can read directly .raw file that LTspice generates.
FFT properties
It can read directly .raw file that LTspice generates.
I am trying the matlab option. You need first translate LTspice .raw data to matlab format by the following script free download.
Fast Import of Compressed Binary .RAW Files Created with LTspice Circuit Simulator - File Exchange - MATLAB Central
Fast Import of Compressed Binary .RAW Files Created with LTspice Circuit Simulator - File Exchange - MATLAB Central
I tried another approach. If this FFT needs many cycles, so why not not give many but low sampling rate. I think this FFT algorithm is copied from real time measurement as audio 44khz sample rate. This is 44 samples /cycle for 1khz.
In order each cycle provide another set of few samples the sample rate should be asynchronous with the frequency. There must be the optimum sample number vs number of cycle, frequency.
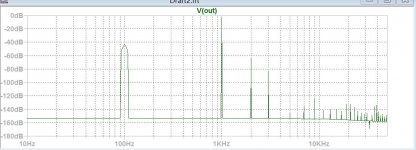
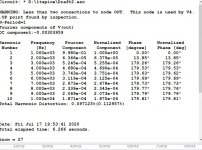
Here I introduced 100 hz to see eventual power supply ripple can pollute at high power. You can compare the Fourier analysis list with the precedent single cycle, how the measurement is wrong , but on the FFT it is more precise. This means two simulations are needed, first single cycle with 10k points to get precise numbers, a second to get precise spectrum graph. If want to help me, you need to vary the number of cycles / sample rate, here is 100 cycles 1ms/6us rate. The purpose is to eliminate the nonexisting harmonics.
In order each cycle provide another set of few samples the sample rate should be asynchronous with the frequency. There must be the optimum sample number vs number of cycle, frequency.
Here I introduced 100 hz to see eventual power supply ripple can pollute at high power. You can compare the Fourier analysis list with the precedent single cycle, how the measurement is wrong , but on the FFT it is more precise. This means two simulations are needed, first single cycle with 10k points to get precise numbers, a second to get precise spectrum graph. If want to help me, you need to vary the number of cycles / sample rate, here is 100 cycles 1ms/6us rate. The purpose is to eliminate the nonexisting harmonics.
Attachments
Last edited:
It's not me who wants to repeat the same data numerous times. A good FFT needs one cycle only after which according to sampled rate it gives the required definition here is an example shown here https://kluedo.ub.uni-kl.de/frontdoor/deliver/index/docId/4293/file/exact_fft_measurements.pdf
This FFT needs many identical cycles to understand the situation , I don't see how to command the FFT to read in cyclic the same data. It looks stupid, what can we do else?
Hayk
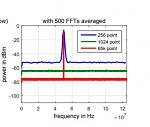
But all the curves here give exactly the same information on the harmonic magnitude. As long as it comes out above the noise, that should be OK.
Jan
Attachments
Last edited:
Ok, but not beautiful. To tell you the story from the beginning, once upon a time there was a Marantz 8b amplifier that the Japanese audio enthusiasts found it extraordinary articulated voice ,"Intelligible" for Europe. After analyzing the distortion spectrum, they found out it had very high content of 2H and regular regression for succeeding harmonics, very similar to SE triodes. By this result people think if you paint a piece of iron, red, than it will be glassing hot. This idea propagated via J. Hiraga and his books , from which consumers of no knowledge when they see the spectrum of the chemical analysis of a wine how it should be, than that wine? he should enjoy it. This why the amplifier designer must show beautiful spectrum to sell his wine.
Last edited:
I tried another approach. If this FFT needs many cycles, so why not not give many but low sampling rate. I think this FFT algorithm is copied from real time measurement as audio 44khz sample rate. This is 44 samples /cycle for 1khz.
In order each cycle provide another set of few samples the sample rate should be asynchronous with the frequency. There must be the optimum sample number vs number of cycle, frequency.
Basically the DFT samples your waveform and then figures out what sines and cosines have to be added to each other to get a waveform that passes through the samples. When you do a DFT over a time T, it will only use sines/cosines at frequencies that are multiples of 1/T, so the result repeats every T and therefore also fits the periodic continuation of the piece of waveform that you did the DFT over.
When you fit an integer number of cycles of all frequencies of interest in the time interval T, there are no jumps in the periodic continuation and you get a clean spectrum without needing tricks like windowing - although windowing is sometimes still useful to reduce the effect of imperfect settling. It is usually handy to make T at least twice as long as needed to fit in an integer number of cycles, so you get a zero result between each two spectrum points (and you know there is something wrong when the floor between the spectral peaks is not very close to zero). For the same reason, with Hann windowing you need T to be at least four times as long as needed to fit in an integer number of cycles. You may need much more to get a pretty looking spectrum.
Besides, you have to prevent aliasing. That is, the highest frequency must be less than N/(2 T) where N is the number of points of the DFT. If that requires an impractically large number of points, you can simply add a tenth-order Butterworth low-pass filter or so to your circuit and run the DFT on the filter's output, making sure the filter has had enough time to settle.
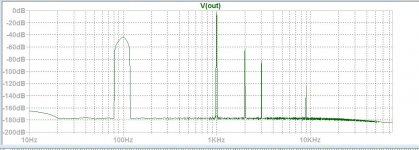
I did arrive to an excellent result. it uses 100 cycles with 1000 samples/ cycle. The FFT viewer is set to Hamming window 5 point binomial smoothing and 15000 data points used to limit the high frequency to about 60khz.The values are now very precise and extra clean floor so that the noise of the amplifier can express itself. The value 0.99999us is used instead of 1us to allow a beat and sample by sliding on the fundemental.

Now, I reached to the end of my investigation. I will resume with two set of scripts one for FFT and the other for FA, so that the LT user needs only to copy/paste the commands and get a normalized measuring script.
Hayk
Now, I reached to the end of my investigation. I will resume with two set of scripts one for FFT and the other for FA, so that the LT user needs only to copy/paste the commands and get a normalized measuring script.
Hayk
Attachments

Interesting that a free simulator can handle DFT sizes that are not a power of two, while the very expensive Cadence Virtuoso IC design package can not.
I use the tool described here:
LTSPICE THD Analyzer
It bundles up all the usual settings and does frequency and amplitude stepping as well if desired.
Another one similar found here
Audio Total Harmonic Distortion Analyzer for LTSPICE, making THD vs. Amplitude and Frequency sweeps in LTSPICE | Audio Perfection
My FFT adjustment gives very precise harmonic measurements in rms db. I wonder if someone has done a .meas script to derive from FFT results the THD?
Hayk
- Home
- Design & Build
- Software Tools
- how to measure precisely distortion with LTspice?