Hmm interesting on the numdgt = 8 but it makes things look even less realistic than when it uses single precision 😉 useful I guess for digging out whether there are any harmonics buried in the noise floor, not that the noise floor is in any way realistic 🙂
As I said originally ridiculously low distortion figures in a spice simulation really mean nothing. When you get to real world implementation they will generally be a lot worse. I use it for trending. If it gets better when I do something in spice, it will probably be better in real world, if it gets worse it will probably be worse, but you still need to build and test and make sure for yourself. layout and parasitic will affect the results in the real world, as will imperfect components.
Tony.
Demo for Exporting and Importing wave files
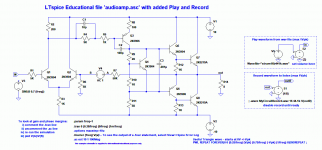
Attached is a demo file showing how to use a recorded waveform as a signal source for a circuit. Also recording the output of your circuit as a wavefile. You can listen to the recording on your computer. I use Audacity to select portions and change file formats (but you need to install appropriate codec's).

You could use this method to import a recording of a real amp and do an FFT on the recording. It is limited to 16 bits -- IIRC 96dB range, 0.003%.
Tips on using the file:
LTspice wav files are +/-1V peak max.
Set E2 for the required input voltage. Set E1 so the recording is not overladed, eg view the largest peak voltage then enter {1/<peak>} for E1 gain.
Set the input wave filename -> Wavefile="<name>16b441k.wav"
and quotes are needed, include the '16b441k' so you use the right settings in eg Audacity.
The -> ; .wave MyCircuitRecord.wav 16 44.1k V(outR)
This has a comment so you can run your circuit first (without doing a recording) to check the input and output voltage levels are all correct and use a appropriate filename (you can shorten the trans statement to speed up this check run). Remove the semicolon (comment) to save the waveform to file. The file goes into your working directory.
Using -> .tran 0 {0.38/freq} {0/freq} {1m/freq}
Use freq=1 generates a 380ms recording (to suit the input file duration)
The {1m/freq} sets the max simulation step size resolution to 1000 steps per cycle eg valid in this case to several kHz of harmonics. If it's set smaller it can take a lot longer. Try reducing it to see if it takes too long.
If you want to disable the input recorded signal and use V3 (eg pure sinewave or whatever) them break the connection from E2 output to the "in" connection (it's OK if they float). Wire V3 output to the input "in".
Use -> .tran 0 {1000/freq} {0/freq} {1m/freq}
eg with freq=1k you will generate 1000 cycles each with 1us max step size.
All the best
Hi Hayk,...Ian Heggulen told me LT can export the result in .wav format.
Attached is a demo file showing how to use a recorded waveform as a signal source for a circuit. Also recording the output of your circuit as a wavefile. You can listen to the recording on your computer. I use Audacity to select portions and change file formats (but you need to install appropriate codec's).
You could use this method to import a recording of a real amp and do an FFT on the recording. It is limited to 16 bits -- IIRC 96dB range, 0.003%.
Tips on using the file:
LTspice wav files are +/-1V peak max.
Set E2 for the required input voltage. Set E1 so the recording is not overladed, eg view the largest peak voltage then enter {1/<peak>} for E1 gain.
Set the input wave filename -> Wavefile="<name>16b441k.wav"
and quotes are needed, include the '16b441k' so you use the right settings in eg Audacity.
The -> ; .wave MyCircuitRecord.wav 16 44.1k V(outR)
This has a comment so you can run your circuit first (without doing a recording) to check the input and output voltage levels are all correct and use a appropriate filename (you can shorten the trans statement to speed up this check run). Remove the semicolon (comment) to save the waveform to file. The file goes into your working directory.
Using -> .tran 0 {0.38/freq} {0/freq} {1m/freq}
Use freq=1 generates a 380ms recording (to suit the input file duration)
The {1m/freq} sets the max simulation step size resolution to 1000 steps per cycle eg valid in this case to several kHz of harmonics. If it's set smaller it can take a lot longer. Try reducing it to see if it takes too long.
If you want to disable the input recorded signal and use V3 (eg pure sinewave or whatever) them break the connection from E2 output to the "in" connection (it's OK if they float). Wire V3 output to the input "in".
Use -> .tran 0 {1000/freq} {0/freq} {1m/freq}
eg with freq=1k you will generate 1000 cycles each with 1us max step size.
All the best
Attachments
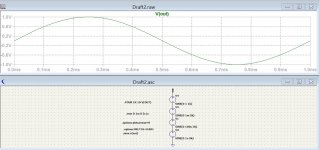
In addition to Ian's changing to use the actual frequency in the .four, change your time to start saving data to say 20ms to get rid of that sloping. If you look at the beginning of the sim it takes longer than 3ms for the voltage to stabilize.
Tony.
Tony.
Attachments

Last edited:
Ian, that is useful on the setting levels when using a .wav. Thanks 🙂
I experimented with this a couple of years ago and ran into an odd issue when using Audacity to create tracks. I made notes at the time and so I will just quote what I noted down for future reference.
Length of time to create such files was always an issue. I don't know if you ever came across the thread (files are long gone now unfortunately) but the results were really interesting.
Welcome to the (virtual) listening room.
I experimented with this a couple of years ago and ran into an odd issue when using Audacity to create tracks. I made notes at the time and so I will just quote what I noted down for future reference.
NOTE...
In creating stereo files (split to mono) in Audacity something odd happens. The right channel .wav file, while perfect in media player, will not function in LTspice. The final output from the circuit under test is just silence.
To correct this, first split the tracks and export the left file as normal. Now undo (use edit>undo) and now reverse the tracks. Again export the left channel (which is now the right of course). That seemed to work.
Length of time to create such files was always an issue. I don't know if you ever came across the thread (files are long gone now unfortunately) but the results were really interesting.
Welcome to the (virtual) listening room.
Hi Mooly,I don't know if you ever came across the thread (files are long gone now unfortunately) but the results were really interesting.
I think I was watching it (before I joined). But it was this this later thread Test your ears in my new ABX test and the following comment (Post 415) that really caught my attention:
You are probably aware that I did some listening tests on crossover distortion for my Linear Audio Vol.4 article and found crossover distortion was not able to account for differences in amplifier sound, contrary to what most seemed to be saying. So my thoughts turned to amplifier clipping as a more significant difference for "amp sound" ... and so ... my Linear Audio Vol.8 cube-law amp had soft clipping built in AND a clip detector as well (with light level roughly correlating with the audibility of the clipping).After all these tests though, I can't help but feel that crossover distortion is only part of the story as to why amplifiers can sound very different in real use...
Maybe someone could set up some LTspice based virtual simulations to check my hypothesis: that amplifier clipping is a more significant indicator for "amplifier sound" than crossover distortion -- assuming crossover distortion is below 0.01% (as it is in most designs these days).
Cheers,
Here's Sandrohv's video of measuring distortion. Might help
5.2.2. Measuring harmonic distortion in LTSpice, DEMO - Part 2 - Audio Amplifier Design Fundamentals - YouTube
5.2.2. Measuring harmonic distortion in LTSpice, DEMO - Part 2 - Audio Amplifier Design Fundamentals - YouTube
Hi Mooly,
I think I was watching it (before I joined). But it was this this later thread Test your ears in my new ABX test and the following comment (Post 415) that really caught my attention.......................
Maybe someone could set up some LTspice based virtual simulations to check my hypothesis: that amplifier clipping is a more significant indicator for "amplifier sound" than crossover distortion -- assuming crossover distortion is below 0.01% (as it is in most designs these days).
Cheers,
Hi Ian, those threads were good fun but they are very time consuming to put together.
When I listen to real world amps at my normal listening levels I am way way below clipping levels and yet the different topologies instantly impart their own character on the sound (well I find it so). I suspect there is more going on beside clipping behaviour tbh but it is very elusive and difficult to say why one design has that magic in it delivery of the music and another does not.
I looked over the FFT character of LT. First I , who use Multisim, Tina, is to return back to 60's style software , as model A Ford you need to adjust the fuel richness, ignition timing, etc to start the engine. If it is to program it, I prefer to use the Matlab online, that I am more keen on and lot of Matlab scrips are avilable as Vibration Analysis: FFT, PSD, and Spectrogram Basics [Free Download] .
The simple RC distortion measurement, with the last Mooly way, is occupying 196MB memory, that my pad gets quickly inusable. The primitive software doesn't erase it automatically.
What is wrong in the measurement principle is explained on youtube indicated on post 28. The generous fellow of non engineering knowledge, shows a formula after which he decides to increase the number of cycles to be sampled. This is 100% wrong. The formula shows the relation of number of samples /cycle, it is similar to ADC definition.As all the distortion information is in a single cycle , the simulator must accumulate data of a single cycle with many samples, ok , but this gives time dependent definition for the horizontal axis. The vertical axis needs also to be of higher precision, I found on Pspice commands the RELTOL option, maybe it will enhance.
The start delay time of 1ms or 20ms is not adequate with amplifiers equipped with servo, as it cost no time , better delay 1s.
Save command allows only the output data to be saved, this should decrease the memory space and time.
On Analog Device technical advises, uses not 8 but 15 NUMDGT.
Last edited:
"after which he decides to increase the number of cycles to be sampled. This is 100% wrong. "
It doesn't do anything to improve the FFT, I agree. But it does lower the noise floor because it makes the frequency bins narrower so each bin will have less noise.
This is how it works in real circuits, but I am not sure it works like this in LTspice, as LTspice doesn't calculate noise levels in a .tran on which the FFT is based. Noise simulation with .noise appears a separate simulation process.
Jan
Thank you jan averting about noise issue. I totally forgot that the measurements we are dealing is Dtot+Noise. May be noise is to be measured first without signal, than subtract from the signal. It looks more complicated.
There is a difference in this between distortion measurement and an FFT measurement.
In an FFT the noise is only of interest if the harmonic spurs do not come out of the noise. If they come out of the noise, the measurement is accurate.
And, as I mentioned, by taking longer and longer FFT measurements, which means narrower and narrower bins, the noise can be made almost arbitrarily low. The penalty you pay is time. I have done 80sec FFT measurements which gave a noise floor of -170dB, which is 3.16nV. But that is in a very narrow band, like 0.05Hz, so to get the 'real' noise level in the audio band you have to multiply the noise level with SqRt of the bandwidth ratio.
If you do a distortion measurement normally you measure everything that remains after the fundamental is notched out. So you can't easily separate out the noise. You can of course measure all the harmonics and calculate the distortion without the noise, but that is basically the same as an FFT with some post-processing.
Jan
If I did understood, The LTspice distortion measurements listing is not Dtot + Noise as Tina calculates , but the noise excluded. Neochrome way, advertising modulus86 to be 0.00006% Dtot, where in real is 0.002% Dtot+Noise. Now I understand why optimist designers are so happy with LTspice.
Last edited:
Single Cycle Distortion Analysis
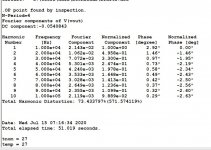
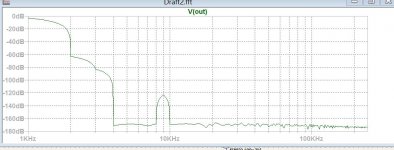
I created four generators in series , the fundamental 1khz 1V, 2H 1mv, 3H 100uv and 9H 1uv.
It captures only one cycle, but 10000 samples . The Fourier list shows precisely these values.
The FFT lacks bandwidth to show beautiful pictures. I didn't find a way to make the FFT read the same wave multiple times to refine the bandwidth. The noise is ok.
I am looking how to manipulate the output data. If the FFT can read only a portion of the transient calculation, there must be a way to ask it read cyclic way to overcome it's wide bandwidth. To note that other FFTs can resolve in real time much higher resolution of single burst , but for a free software, one must be thankful for what it is.
Hayk
Attachments

Last edited:
Why would you want to repeat the same data? That just boils down to inserting zeros between the frequency points that the DFT already calculates. If you want to get an impression of the simulation noise floor, imperfect settling and any other artefacts, just take an integer number of cycles, at least two when you don't use windowing and four when you use a Hann window.
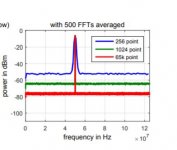
It's not me who wants to repeat the same data numerous times. A good FFT needs one cycle only after which according to sampled rate it gives the required definition here is an example shown here https://kluedo.ub.uni-kl.de/frontdoor/deliver/index/docId/4293/file/exact_fft_measurements.pdf

This FFT needs many identical cycles to understand the situation , I don't see how to command the FFT to read in cyclic the same data. It looks stupid, what can we do else?
Hayk
This FFT needs many identical cycles to understand the situation , I don't see how to command the FFT to read in cyclic the same data. It looks stupid, what can we do else?
Hayk
Attachments
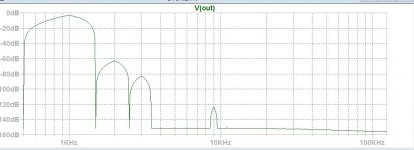
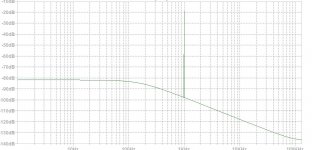
And that's just fine: it shows the magnitude of the spectral components and near-zero values (-150 dB) in between those components. What more do you want?
The curved lines in between the DFT bins are just an artefact of the plotting program, apparently it interpolates the voltage linearly which results in curved lines when the vertical axis is logarithmic/in dB.
The curved lines in between the DFT bins are just an artefact of the plotting program, apparently it interpolates the voltage linearly which results in curved lines when the vertical axis is logarithmic/in dB.
It's not me who wants to repeat the same data numerous times. A good FFT needs one cycle only after which according to sampled rate it gives the required definition here is an example shown here https://kluedo.ub.uni-kl.de/frontdoor/deliver/index/docId/4293/file/exact_fft_measurements.pdf
This FFT needs many identical cycles to understand the situation , I don't see how to command the FFT to read in cyclic the same data. It looks stupid, what can we do else?
Hayk
The plot you show here clearly uses more than one cycle of the signal, otherwise you would get a value at zero frequency, a value at the signal frequency, a value at twice the signal frequency and so on. Depending on the plotting routine, you would either get some interpolated curve or zero or nothing at all in between. I think they used about 50 cycles for the length = 256 plot, about 200 for length = 1024 and about 12800 for length = 65536.
Last edited:
- Home
- Design & Build
- Software Tools
- how to measure precisely distortion with LTspice?