A recently deleted comment at Stereophile (or maybe I can't find it) compared the frequency response of the B&W 802 D2 vs. D3. The author's point was that there was no significant difference. The original author did it with PhotoShop skills but I decided to do the same with SPLCopy and OmniMic. When I did so I discovered something else quite special. The Golden Ear Triton has a very similar frequency curve. Here I've been thinking they were being influenced by advertising dollars when a completely new hypothesis for the incredible reviews has come up: They just have hearing loss.
Check it!
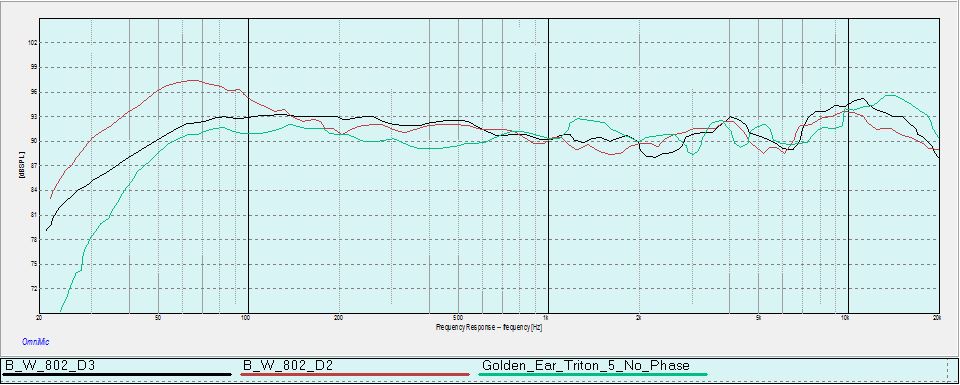
You can do the same, with SPLCopy or something like it. Just grab the online FR images and chart them, then you can use OmniMic, Google Sheets, Excel, whatever.
I did not apply any scaling deliberately. They just lined up that way, but I may not have gotten the sensitivity right on each chart.
Check it!
You can do the same, with SPLCopy or something like it. Just grab the online FR images and chart them, then you can use OmniMic, Google Sheets, Excel, whatever.
I did not apply any scaling deliberately. They just lined up that way, but I may not have gotten the sensitivity right on each chart.
Attachments

Last edited:
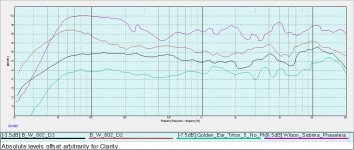
Your plot (in the first post) has 3dB grid lines and so it does not make it easy to distinguish the red and black curves. Even MINUTE differences over a wide enough band can be discerned in blind testing. At the extreme width of the entire audio band, less than 0.5dB of level difference can be detected. For example, this is why it is important to have levels matched to less than that threshold when comparing speakers in A-B type listening tests. The tendency is to prefer the "louder" speaker. As the bandwidth of the frequency response difference gets smaller, the amount of difference grows larger. There are studies in which an "EQ peak" having some gain and Q is introduced and the threshold of audability versus Q (e.g. how "high" the peak must be in dB for a given Q) was studied. Can't recall a reference for that study but maybe someone else can chime in on that.
I would label these curves as being quite different. Anyway, there is much more to a loudspeaker than its frequency response measured on *some* axis!
I would label these curves as being quite different. Anyway, there is much more to a loudspeaker than its frequency response measured on *some* axis!
Hi Charlie,
I'd suggest you go to the original graphs, as there's no way a copy from a chart will do any speaker justice. What I can say is that there is a common behavior of a dip at around 6 kHz and a broad hump centered around 11 kHz. I can also say I don't like any of those speakers (except the Wilsons).
My point was not that you couldn't hear the difference between a D2 and D3. My point is that all three of these highly touted speakers are gimmicked the same way.
BTW, I don't dislike the sound of the Wilson's, I just can't imagine paying the prices they are asking for the value presented. If they were invisible, tiny and free, I could use them as surrounds I guess. 🙂
Best,
Erik
Last edited:
I am not a fan of Wilson, nor Stereophile, but your curves and curves based arguments
are simple ********...😕
are simple ********...😕
Last edited:
The curves aren't meaningless and I think the conclusion that one can draw from them is simply that the reviews are quite happy to listen to (and highly rate) speakers that are quite less than neutral.
Then again it's their job to be diplomatic as they don't stay in business for slamming products. Even when something sucks they try and find some kind of justification for it. As a 'this speaker has X' the designed probably chose this because of 'Y' to make it seem like a niche advantage rather than simply saying, this speaker has 'X' and it is simply wrong and a huge design error.
B&W have been known to design to a 'house sound/house methodology' for years now and it doesn't seem like they are going to change that. I mean of all the praises they sang of the continuum cone and the issues it was going to solve the 800 series still have the same crappy issues at the top of the midrange/tweeter transition. You solved nothing B&W just more marketing hype to justify a rehash of the old series. Maybe the continuum cone, in isolation, is a step in the right direction, it's still been used badly.
Charlie, I think it was Toole's research that found the unexpected effect (that low-Q resonances tend to be much more audible than high-Q resonances of similar energy). Kind of flies in the face of all the attention that CSD waterfalls get, as they highlight the high-Q not the low-Q resonances.
My argument is simple. Stereophile is praising hearing aids masquerading as speakers. 🙂 If they sincerely want to praise speakers this far from neutral I sincerely, and without insult, want to know if they are suffering from complementary hearing loss.
If manufacturers are designing speakers for rich old white men with common loss in the last octave, this explains much. Im middle aged, and can't afford anything I don't build myself, but my hearing is fine.
Those speakers (Well, OK, haven't heard the D3) sound exactly as the graphs would lead me to believe by the way. We can argue about the subtle scents wafting in off the speaker's cone till the cows come home, and about the images of flaura and fauna playing the 18th copy of Vivaldi's tribute to his cat, but these is not a subtle tuning.
Last edited:
my argument is simple. stereophole is praising hearing aids masquarading as speakers. 🙂 if they genuinelyvpraise speakerz this far from neutral i sincerely, and without insult, want to know if they are suffering from hearing loss. if manufacturers are designing speakers for rich old white men with common loss in the last octave, this explains much. im middle aged, but my hearing is fine. those three speakers sound exactly as the graphs would lead me to believe.
Your hearing is fine but your writing could use some work.
Your hearing is fine but your writing could use some work.
That will always be true I'm afraid. Sorry was typing from a bar at the end of a basketball game. 🙂
Erik
Thanks 5th!
One other kind of counter point. The Stereophile review of the Sony AR1's was merely lukewarm. They lacked that last octave hump, but were smile-shaped.
When I finish moving I may get a miniDSP just to listen to what this curve sounds like. In fact, if any of you have one and want to play with it, let me know I'll shoot you the raw, or just SPLCopy (or whatever) from the Stereophile web site. Clearly, this won't recreate the sound of any particular speaker, but it should demonstrate just what the benefits of this tuning does.
Best,
Erik
The curves aren't meaningless and I think the conclusion that one can draw from them is simply that the reviews are quite happy to listen to (and highly rate) speakers that are quite less than neutral.
Then again it's their job to be diplomatic as they don't stay in business for slamming products. Even when something sucks they try and find some kind of justification for it. As a 'this speaker has X' the designed probably chose this because of 'Y' to make it seem like a niche advantage rather than simply saying, this speaker has 'X' and it is simply wrong and a huge design error.
B&W have been known to design to a 'house sound/house methodology' for years now and it doesn't seem like they are going to change that. I mean of all the praises they sang of the continuum cone and the issues it was going to solve the 800 series still have the same crappy issues at the top of the midrange/tweeter transition. You solved nothing B&W just more marketing hype to justify a rehash of the old series. Maybe the continuum cone, in isolation, is a step in the right direction, it's still been used badly.
Contrasting and comparing diy with commercial speakers and the industry they are in is one way in which we define ourselves and happens here routinely. Personally, it helps me realize that im not nuts, they are. ;-)
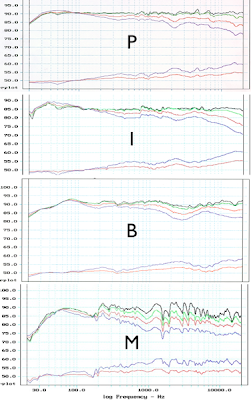
It has been clearly and several times tested and stated, that frequency response curve is the most significant single measurement, to value speaker's sound. Smooth directivity and bass reach might be on medals too. Distortion is far less important (until extreme spl)
This is relevant for diyers too, to set goals and value different things about speakers.
Audio Musings by Sean Olive: Part 3 - Relationship between Loudspeaker Measurements and Listener Preferences

This is relevant for diyers too, to set goals and value different things about speakers.
Audio Musings by Sean Olive: Part 3 - Relationship between Loudspeaker Measurements and Listener Preferences
I know designing for flat and neutral (possibly even a down sloping top end) is the holy grail among the DIY world. I'm 49 and I like a lifted last octave or two. That sounds like an AA meeting opener🙂 I don't use much BSC but I don't mind a bit of a bump below 100. This could be age related hearing loss but I ran sound for quite a few live gigs when I was 20 and in college. I remember my go to house sound then was a bit of a smiley so I guess I've always preferred that . Maybe I'm one of those people OEM's aim the marketing at or maybe I'm nuts.
I kinda miss the old speakers with facemounted Lpads so we could each tweak our preference.
David
I kinda miss the old speakers with facemounted Lpads so we could each tweak our preference.
David
In what way is this DIY? Or have we slipped over into another forum?
Basically it's a sly self-compliment, like that recent commercial where the woman says "I hate going to musicals because I have perfect pitch"
Contrary view: if you have upper octave hearing loss (as all of us old guys do), it affects the sound of live music as well. So a speaker which sounds "live" won't have that tipped up treble region. I suspect that the reviewer chimps are working off old memories of live music's sound, and the manufacturers are accommodating this- my experience at AXPONA the past few years has been cringing at one ear-laser after another.
From SY's sig line:
LOL😉
To the Class of 2050 - The New Yorker
Remember: life is ten per cent what happens to you, ten per cent how you respond to it, and eighty per cent how good your reflexes are when the Tall Ones come at your throat with their pincers.
LOL😉
To the Class of 2050 - The New Yorker
I know designing for flat and neutral (possibly even a down sloping top end) is the holy grail among the DIY world. I'm 49 and I like a lifted last octave or two. That sounds like an AA meeting opener🙂 I don't use much BSC but I don't mind a bit of a bump below 100. This could be age related hearing loss but I ran sound for quite a few live gigs when I was 20 and in college. I remember my go to house sound then was a bit of a smiley so I guess I've always preferred that . Maybe I'm one of those people OEM's aim the marketing at or maybe I'm nuts.
I kinda miss the old speakers with facemounted Lpads so we could each tweak our preference.
David
Hi David,
I think the holy grail among DIYers is to design what makes you happy for as little as possible. 🙂
However, I haven't seen a single DIY design with this particular "signature" which is in vogue among the High End. Having heard them, vs. measured neutral speakers, OUCH!
As Gravesen puts it:
"Having a +5 dB from 3-11 kHz would from any speaker I've made hurt your ears in a few minutes."
Again, make what you like! 🙂 But if you see speakers in the store and you wonder why you don't like them, here is your answer.
Best,
Erik
All speakers are "voiced" in one way or another. Most people don't know the difference because that's all they ever heard. They expect a speaker to "sound like" something and they are never disappointed.
"Neutral" is a marketing buzzword and is subjective anyway.
And people can hear stuff that they're not even aware of. This can affect their perception. A middle range test tone sounds virtually the same on many, many loudspeakers; musical program most decidedly does not.
Intermodulation distortion, phase and timing errors, dynamic compression; all are audible, and affect people's perception even if they can't articulate it.
Some people have a tin ear and can't hear gross distortion even if it's pointed out to them. Some people think that those one note subwoofers are the state of the art in sound reproduction.
The truth is that our perception is very flawed and this is exacerbated by cognitive biases. At the same time we can perceive a lot of stuff that is simply not measured or even discussed very much. A cheap microphone is much more reliable and consistent than our own hearing from a scientific point of view.
- Status
- Not open for further replies.
- Home
- General Interest
- Everything Else
- How to design speakers for Stereophile reviewers