As far I know and understand in HornResp the Acoustical Power is in PWL terms. How can I correlate those measures with their SPL counterpart?
Given:
PWL = power response in dB
SPL = pressure response in dB
DI = directivity index in dB
Ang = solid radiation angle in steradians
Then:
SPL = PWL + DI - 10 * Log10(4 * Pi / Ang)
For a driver in an infinite baffle radiating into half space (Ang = 2 * Pi steradians):
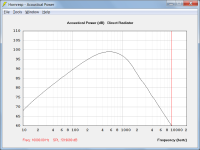
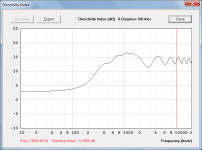
Attachment 1 shows the PWL as having a level of 59.9680 dB at 10 kHz.
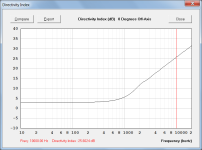
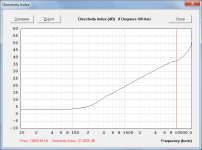
Attachment 2 shows the on-axis DI as having a level of 25.6624 dB at 10 kHz.
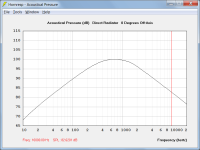
The on-axis acoustical pressure response at 10 kHz is given by:
SPL = 59.9680 + 25.6624 - 10 * Log10(4 * Pi / (2 * Pi)) = 82.6201 dB
Attachment 3 shows the on-axis SPL as having a level of 82.6201 dB at 10 kHz, the same as that calculated above.
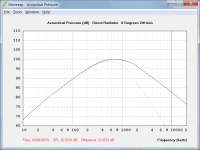
Attachment 4 compares the pressure response (black trace) to the power response (grey trace).
For half space radiation the difference is DI - 10 * Log10(2) dB.
Attachments
Thank you, but I already knew those formulas.
What I don't understand is why using HornResp I get a plot that gets lower as the frequency raises, while using the MJK worksheet and SpicyTL I get a plot that remains (apart the oscillations) constant when raising the frequency.

I don't know if there is some error in the parameters, but I don't care so much in this moment about the differences in level and the positions of the resonances. It's the difference in behaviour that worries me.

The loudspeaker is a Scan Speak 18W/4531-G00.
Thanks again!
What I don't understand is why using HornResp I get a plot that gets lower as the frequency raises, while using the MJK worksheet and SpicyTL I get a plot that remains (apart the oscillations) constant when raising the frequency.
I don't know if there is some error in the parameters, but I don't care so much in this moment about the differences in level and the positions of the resonances. It's the difference in behaviour that worries me.
The loudspeaker is a Scan Speak 18W/4531-G00.
Thanks again!

Does the MJK worksheet and SpicyTL take driver inductance into consideration?
What I don't understand is why using HornResp I get a plot that gets lower as the frequency raises, while using the MJK worksheet I get a plot that remains constant when raising the frequency.
It is simply because Hornresp shows power response, whereas the MJK worksheet attempts to include directivity effects and shows pressure response instead.
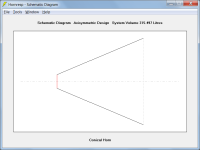
(As far as I know the directivity model used in the MJK worksheet is based on the size of the horn mouth only, and does not take the actual profile of the horn into account. Depending upon the system being analysed this could lead to significant errors in some cases. To illustrate, using the simple conical horn shown in Attachment 1 as a test example, the MJK worksheet would calculate the DI to be as shown in Attachment 2. Because an actual conical horn has constant directivity characteristics, the true DI would be closer to that shown in Attachment 3).
Attachments
We know folks like to use CON and EXP in their models even though they are building PAR enclosures.
Can you please tell me what can be "mathematically" the difference among PAR, CON and EXP when one deals with a cylindrical duct?We know folks like to use CON and EXP in their models even though they are building PAR enclosures.
Is it possible to have the dimensions of the conical horn? ThanksTo illustrate, using the simple conical horn shown in Attachment 1 as a test example, the MJK worksheet would calculate the DI to be as shown in Attachment 2. Because an actual conical horn has constant directivity characteristics, the true DI would be closer to that shown in Attachment 3).
The frequency dependence has to be hidden somewhere! Now I understand that is in DI.It is simply because Hornresp shows power response, whereas the MJK worksheet attempts to include directivity effects and shows pressure response instead.
(As far as I know the directivity model used in the MJK worksheet is based on the size of the horn mouth only, and does not take the actual profile of the horn into account. Depending upon the system being analysed this could lead to significant errors in some cases. To illustrate, using the simple conical horn shown in Attachment 1 as a test example, the MJK worksheet would calculate the DI to be as shown in Attachment 2. Because an actual conical horn has constant directivity characteristics, the true DI would be closer to that shown in Attachment 3).
Is this somewhere in HornResp?
Last edited:
CON = 4 sides are constantly expanding.Can you please tell me what can be "mathematically" the difference among PAR, CON and EXP when one deals with a cylindrical duct?
EXP = expansion like any wind instrument.
PAR = 2 sides run parallel and 2 sides expanding.
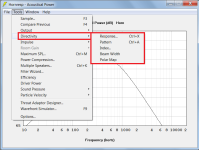
Presume you mean in 'Acoustical Power','Tools', Output', 'Direct Radiator' then 'Tools', 'Directivity', 'Response', choose axis in pop-up window and 'Acoustical Pressure' will be plotted.The frequency dependence has to be hidden somewhere! Now I understand that is in DI.
Is this somewhere in HornResp?
Please reread the question. It helps.CON = 4 sides are constantly expanding.
EXP = expansion like any wind instrument.
PAR = 2 sides run parallel and 2 sides expanding.
I don't know the math.
Common sense says math is not need if you just LOOK at the 3 different horn profiles. 9 out of 10 times, YOU are building a parabolic enclosure.
Common sense says math is not need if you just LOOK at the 3 different horn profiles. 9 out of 10 times, YOU are building a parabolic enclosure.
Can you please tell me what can be "mathematically" the difference among PAR, CON and EXP when one deals with a cylindrical duct?
If S1 is set equal to S2 then the segment will be cylindrical regardless of whether the specified flare type is Con, Exp or Par. There will be no "mathematical difference" in that case.
Attachments


Is it possible to have the dimensions of the conical horn? Thanks
The values used were chosen at random. They had no particular significance.
S1 = 200 cm^2
S2 = 8000 cm^2
L12 (Con) = 100 cm
The frequency dependence has to be hidden somewhere! Now I understand that is in DI.
Is this somewhere in HornResp?
Hornresp has a suite of directivity tools, including one that charts the directivity index. Details are in the Hornresp Help file.
Attachments
Thanks. I want to reproduce the Directivity Index.The values used were chosen at random. They had no particular significance.
I have seen it in HornResp but in the cylindrical example I'm using the menu entry is disabled.
The solutions of the B-WHE look different when the duct is exponential or conical. But, when the duct is cylindric, they can written in the same way obtained by simpler acoustical considerations.If S1 is set equal to S2 then the segment will be cylindrical regardless of whether the specified flare type is Con, Exp or Par. There will be no "mathematical difference" in that case.
- Home
- Loudspeakers
- Subwoofers
- Hornresp