Yes - to me it seems to be the same results - just that I cant do overlay as you show

Thanks for making "tab" available..
Michael
Thanks for making "tab" available..
Michael
Last edited:
Hi David
I finally was able to get the latest version of Hornresp. I live in Canada close to Ottawa the capital. I never had any problems downloading the file from the former server. But to get the latest I had to use a proxy server based in the Netherlands to get it. Wierd!
But get it I did!
Thanks for the updates.
Mark
Greetings,
It might've been asked before, but... Is there any chance that, in some future version, it will be possible to include some active filtering? For tapped horns (at least) it would be quite nice to see / check what frequency to set the low-end high-pass, for anti-overexcursion protection 🙄
🙄
It might've been asked before, but... Is there any chance that, in some future version, it will be possible to include some active filtering? For tapped horns (at least) it would be quite nice to see / check what frequency to set the low-end high-pass, for anti-overexcursion protection
🙄Hi David, one more question
Regarding diaphragm displacement its said in the HELP that it is for a specified input signal.
Can this input signal be selected - or if not - what value is it?
Could you possibly add an option to relate displacement to an specific output SPL of desire as well ?
This would give me a clue on how THD and IM distortion alter relatively, when opimizing overall design.
Just a thought...
By the way capture feature does not work with displacement plot either - maybe its on my system as I run Hornresp under XP in Virtualbox ? - though didn't experience any troubles until now...
Michael
Last edited:
Michael, I would say that 120 dB is somewhat unrealistic with OB-speakers. May be Stig-Erik could comment on this, his setup, which you know I think, would be closer to achieve it. But really even with large conearea I think you will have trouble reaching these levels also with IB speakers.
Effeciency-wise with OB, plain panels will be more efficient than H- and U-baffles which in turn will be more effecient than Ripole and N-baffles, but these last variations can be constructed to go lower in frequency.
/Erling
I've now run a couple of Hornresp simus and IMO it was quite interesting on that subject.
Sure you are right - max SPL depends on type of OB - but with two of the Ripols each side (+9dB in summ) Hornresp tells me that 120dB *free field* can be accomplished roughly up from 60Hz.
Thats for a displacement of 5mm and full AES input of 700W for each double (and all four double 15" in mono-operation assumed) - still an impressive figure I'd say - though it does not tell us anything about the SPL outcome *in room* - and - would burn past 2kW amp power 😱
The most interesting part is that low frequency for full max SPL of 120dB can only be lowered marginally to roughly 40-50Hz when the front to back distance would be doubled (80cm). And what a surprise: infinite baffle wouldn't perform any better than those 80cm !!!
So - *if* one decides to go OB sub, a Ripol isn't any bad 😉
This I very much like from simus - quick guesstimation on optimization trade offs - big thanks to David for providing such a versatile tool !!!
🙂 🙂 🙂
Michael
Last edited:
Just to complete:
With a good 18" we could reach with same config (4 pieces of double Ripol) 120dB free air up from roughly 30Hz
- and with 21"" woofers Beyma 21SW1600 in same config free air 120dB would go up from slightly below 20Hz
Amp power needed is more or less the same in all cases.
I guess I have to ask Stig Erik doing a free air measurement. 😉
Michael
Last edited:
Yes - to me it seems to be the same results - just that I cant do overlay as you show.
Hi Michael,
This is very strange indeed. To capture results it should simply be a matter of:
1. Right-clicking the mouse on any chart to open the 'Capture current results' pop-up menu.
2. Clicking on the 'Capture current results' pop-up menu command to save the data. A red 'Current results captured' message should then be temporarily displayed in the top left corner of the chart to confirm that the information has been stored - see Attachment.
Captured results can then be subsequently compared to other results by selecting the 'Tools' > 'Compare Captured' menu command, or by pressing the F4 function key.
Kind regards,
David
Attachments

But to get the latest I had to use a proxy server based in the Netherlands to get it.
Hi Mark,
Thanks for letting me know that you found a way around the problem - a weird one indeed 🙂.
Kind regards,
David
Is there any chance that, in some future version, it will be possible to include some active filtering?
Hi Khron,
Sorry, but I have no plans to add incoming signal filtering functionality to Hornresp.
My interest lies with the performance of the loudspeaker itself - not with how the signal is processed prior to reaching the loudspeaker 🙂.
Kind regards,
David
Hi Michael,
By default Hornresp assumes a sinusoidal constant voltage input signal. The root-mean-square value of this voltage is given by Eg. When the Maximum SPL tool is used, the voltage level at a particular frequency is derived from the specified value of Pmax or Xmax, depending upon which parameter is the limiting factor.
Sorry, it's not going to happen 🙂.
I suspect that the problem may be with your system 🙂. No-one else has reported similar issues and as you can see from my earlier attachment, the capture feature normally also works with the Diaphragm Displacement chart.
Kind regards,
David
Regarding diaphragm displacement its said in the HELP that it is for a specified input signal. Can this input signal be selected - or if not - what value is it?
By default Hornresp assumes a sinusoidal constant voltage input signal. The root-mean-square value of this voltage is given by Eg. When the Maximum SPL tool is used, the voltage level at a particular frequency is derived from the specified value of Pmax or Xmax, depending upon which parameter is the limiting factor.
Could you possibly add an option to relate displacement to an specific output SPL of desire as well?
Sorry, it's not going to happen 🙂.
By the way capture feature does not work with displacement plot either - maybe its on my system as I run Hornresp under XP in Virtualbox?
I suspect that the problem may be with your system 🙂. No-one else has reported similar issues and as you can see from my earlier attachment, the capture feature normally also works with the Diaphragm Displacement chart.
Kind regards,
David
post1367.
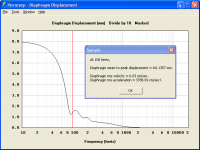
The divide by 10 in the plot.
Does that mean that @ 100Hz the graph is showing displacement ~14mm one way and = 28mm peak to peak?
The divide by 10 in the plot.
Does that mean that @ 100Hz the graph is showing displacement ~14mm one way and = 28mm peak to peak?
I suspect that the problem may be with your system 🙂. No-one else has reported similar issues and as you can see from my earlier attachment, the capture feature normally also works with the Diaphragm Displacement chart.
No wonder - I have to apologize - its all been me, myself and I
🙁 🙁 🙁
Thanks for the answers to all other questions.
Michael
Last edited:
David,
Hornresp appears to vertically scale the calculation result graphs automatically. While this is very convenient, it can lead to problems. For example, if the speaker has a high inductance, the electrical impedance can rise to a very high value at 20 KHz. This means the LF resonance impedance peaks are tiny bumps at the bottom of the graph. To see what I mean, pick any speaker and add 10 mH to its Le value. Then Calculate and display the electrical impedance graph. It's particularly bad on Volvotreter's Tang Band 38 Hz Tapped horn.
In my opinion, a solution that should suit novice and power users alike would be a slider beside the graph, allowing adjustment of the vertical scale. Just a suggestion...
... or maybe an option to limit the frequency range. I notice that the Loudspeaker Wizard graphs only go to 2 kHz or so, reducing the effects of the aforementioned impedance rise.
Last edited:
Don,
In the Electrical Impedance window, select Tools -> Range to select a different graph range. The 'Zoom' option fits the scale to the resonance peak(s). It's explained in the help file.
Bjørn
In the Electrical Impedance window, select Tools -> Range to select a different graph range. The 'Zoom' option fits the scale to the resonance peak(s). It's explained in the help file.
Bjørn
post1367.
The divide by 10 in the plot.
Does that mean that @ 100Hz the graph is showing displacement ~14mm one way and = 28mm peak to peak?
which is it?It would be 0.14mm one way
1.4 / 10
Have the results been plotted after the software has divide by 10 or as David suggests, the user divides what is shown by 10?
Don,
In the Electrical Impedance window, select Tools -> Range to select a different graph range. The 'Zoom' option fits the scale to the resonance peak(s). It's explained in the help file.
Bjørn
Thanks, Bjørn.
Everything I asked for, already there. And I pride myself on "Reading The Manual"... How embarrassing.
Have the results been plotted after the software has divide by 10 or as David suggests, the user divides what is shown by 10?
Hi Andrew,
For the example you quoted, the user should divide Y-axis displacement values by 10.
When in doubt the Sample tool can always be used to check actual values. See the screenprint below and the Diaphragm Displacement description on page 6 of the Help file.
Kind regards,
David
Attachments
Hi Don,
Just to complete the picture - the Range tool can also be used with the Group Delay chart.
Kind regards,
David
Just to complete the picture - the Range tool can also be used with the Group Delay chart.
Kind regards,
David
Thanks for the answers to all other questions.
Hi Michael,
You're welcome 🙂.
One thing I should have perhaps clarified in my earlier message - the loudspeaker will only see a constant frequency-independent input voltage of Eg if the amplifier output resistance Rg is set to the default value of zero ohms.
Kind regards,
David
- Home
- Loudspeakers
- Subwoofers
- Hornresp