Dear Mr McBean,
I founded some errors in the 28 version.
While on Spectrogram panel, mouse button hold on the graph and when the pointer tresspass the border of window, hornresp shows "runtime error '9': subscript out of range" and quits.
Also crashes when importing old exports of driver parameters (done from version 26.50). When importing data from version 25.50 and 27.10, shows "not a valid record", but no crashes. No problem when importing data exported from version 28.
And a small difference in the Vtc parameter on the main panel and the one in Loudspeaker Wizard: on the first the number is limited to 999999,9, but the slider in the Wizard allows any value without restriction. No error there, simply distinct behaviour.
Best regards, Sir.
Sorry - I cant do ..
Hi Michael,
In Edit mode, either:
1. Double-click on the Nd label until CH is selected.
2. Double-click on the Nd text box to open the Driver Arrangement tool and then choose the Compound Horn option.
3. Select the Tools > Driver Arrangement menu command and then choose the Compound Horn option.
Kind regards,
David
Last edited:
I founded some errors in the 28 version.
Hi witasso,
Many thanks for this excellent feedback. I am extremely busy at the moment, but I will investigate the three issues you have identified just as soon as I can, and let you know the outcome.
It may take several days before I can get back to you.
Kind regards,
David
Thanks Erling and Dave - I think I got it now !
Here is the data and simu of above Ripol


And here with the "combined path" feature:

What you think could be the correct simu here - with or without combined path ???
Michael
Here is the data and simu of above Ripol
And here with the "combined path" feature:
What you think could be the correct simu here - with or without combined path ???
Michael
Hornresp Bug Fixes
Hi witasso,
I managed to find some spare time earlier than expected 🙂.
This bug has now been fixed. Please note that the Spectrogram time, frequency and level values will be displayed even when the mouse button is not depressed. The bug was also present in the Directivity Polar Map.
I have found and fixed one bug but I am not certain that it completely resolves all of the record import problems you experienced. Could you please check again with the three versions you tried before, and let me know if there are any remaining issues that still require attention. Note that there was no Version 25.50 of Hornresp - did you perhaps mean Version 25.00?
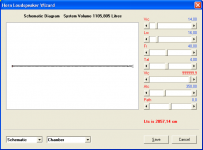
So that I can investigate further could you please provide a screenprint of the Version 28.00 Loudspeaker Wizard showing a Vtc slider value greater than 999999,9. It was certainly possible to generate larger values in earlier versions of Hornresp, but I thought that I had fixed this anomaly some time ago. I was not able to reproduce the problem myself using Product Number 2800-100725, even by directly typing 9999999999 into the Vtc slider control - see attached.
Thanks again for your very valuable feedback. The latest Hornresp release is Product Number 2800-100812.
Kind regards,
David
Hi witasso,
I managed to find some spare time earlier than expected 🙂.
While on Spectrogram panel, mouse button hold on the graph and when the pointer tresspass the border of window, hornresp shows "runtime error '9': subscript out of range" and quits.
This bug has now been fixed. Please note that the Spectrogram time, frequency and level values will be displayed even when the mouse button is not depressed. The bug was also present in the Directivity Polar Map.
Also crashes when importing old exports of driver parameters (done from version 26.50). When importing data from version 25.50 and 27.10, shows "not a valid record", but no crashes. No problem when importing data exported from version 28.
I have found and fixed one bug but I am not certain that it completely resolves all of the record import problems you experienced. Could you please check again with the three versions you tried before, and let me know if there are any remaining issues that still require attention. Note that there was no Version 25.50 of Hornresp - did you perhaps mean Version 25.00?
And a small difference in the Vtc parameter on the main panel and the one in Loudspeaker Wizard: on the first the number is limited to 999999,9, but the slider in the Wizard allows any value without restriction. No error there, simply distinct behaviour.
So that I can investigate further could you please provide a screenprint of the Version 28.00 Loudspeaker Wizard showing a Vtc slider value greater than 999999,9. It was certainly possible to generate larger values in earlier versions of Hornresp, but I thought that I had fixed this anomaly some time ago. I was not able to reproduce the problem myself using Product Number 2800-100725, even by directly typing 9999999999 into the Vtc slider control - see attached.
Thanks again for your very valuable feedback. The latest Hornresp release is Product Number 2800-100812.
Kind regards,
David
Attachments
Last edited:
Michael, as you can see in the help-file you can get the front horn, the back horn or the combined response from the simulation. With the 2Pi model you will hear the combined response in your room.
/Erling
/Erling
Dear Mr. McBean:
I have observed the buggy behaviour of the Spectrogram by casuality, of course no need to press the mouse button and normally it was very umprobable to see the problem.
The import feature now is working fine. The version of the affected imported files was 25.60, my mistake.
Also I was wrong reporting the issue of the slider in Loudspeaker Wizard, it stops at 999999,9, sorry.
Thanks, Sir.
Best regards.
The import feature now is working fine.
Also I was wrong reporting the issue of the slider in Loudspeaker Wizard, it stops at 999999,9, sorry.
Hi witasso,
Excellent. Many thanks for confirming that everything is now working correctly.
Please let me know if you find any more bugs.
Kind regards,
David
Michael, as you can see in the help-file you can get the front horn, the back horn or the combined response from the simulation. With the 2Pi model you will hear the combined response in your room.
/Erling
So the middle plot would be fine ?
This would certainly better fit to the "so la la" measurements I've done .
As for bugs:
David I had noticed that when entering values for "S5" in my simu there was no way to simply jump to "S6" by pressing tab.
The next field that gets activated is "Ang"
In the "max SPL plots" the feature to compare with previous simu seems to be not working correctly - the previous trace is way down.
By the way - is there a feature to overlay several traces of different simus - not just two?
Michael
Michael, well measurements of bass response can be tricky. But allowing for the wavelenghts involved response should be closer to your last plot. This will also I think conform to Rudolf's and my simulation for indoor room response. But too nearfield measurement will definitely give another answer. The first plot is for the front 'horn' only disregarding the back output.
/Erling
/Erling
Ok - so I understand the response of the back wave is *only* overlaid when I use the "combined response" feature and enter the correct delay distance ...
Bad news 🙁 for Ripol max SPL I guess - I was hoping to get a 120dB up from 50-60Hz out of two such double 15" boxes each side. Seems it happens one octave up at best.
Will see if I can find a setup here to make some meaningful measurements in that department to verify.
Michael
Bad news 🙁 for Ripol max SPL I guess - I was hoping to get a 120dB up from 50-60Hz out of two such double 15" boxes each side. Seems it happens one octave up at best.
Will see if I can find a setup here to make some meaningful measurements in that department to verify.
Michael
Last edited:
Michael, I would say that 120 dB is somewhat unrealistic with OB-speakers. May be Stig-Erik could comment on this, his setup, which you know I think, would be closer to achieve it. But really even with large conearea I think you will have trouble reaching these levels also with IB speakers.
Effeciency-wise with OB, plain panels will be more efficient than H- and U-baffles which in turn will be more effecient than Ripole and N-baffles, but these last variations can be constructed to go lower in frequency.
/Erling
Effeciency-wise with OB, plain panels will be more efficient than H- and U-baffles which in turn will be more effecient than Ripole and N-baffles, but these last variations can be constructed to go lower in frequency.
/Erling
Well - calculating max SPL with the spreadsheet of Siegfried Linkwitz, it tells me that those levels are within reach. It's just that we actually do not gain anything here from whatever bass dipole principle - going through the Hornresp simus, they all seem end up roughly the same max SPL in this department.
So with Ripol FR is kinda extended (as a trade off to efficiency) but max SPL is more or less the same (can be shifted slightly though)
As my speakers usually are full active, all that counts is SPL SPL SPL
But the good news is that Ripol being the most compact footprint I can think of (40x40x40 for two 15") that nevertheless suits my needs in small listening rooms.
Quite some useful clarification already for just a few days of playing around with Hornresp. and a good basis for further investigation.
Thanks David and Erling for your kind help so far !!!
Michael
Last edited:
Hi Michael,
Good pickup - thanks. The tab sequence was originally configured to bypass those horn segment input boxes that are auto-populated. I overlooked updating this arrangement when the Compound Horn option was added. It should be possible for me to fix this in the next day or so.
To compare Maximum SPL plots from two different records it is necessary to use the 'Compare Captured' rather than the 'Compare Previous' option. This is because the previous result will be the default SPL plot of the second record rather than the Maximum SPL plot of the first record - which is why your previous trace is way down compared to the Maximum SPL plot of the second record. See the Compare tool description on page 12 of the Hornresp Help file for details on how to capture and release results.
Sorry, no 🙂.
Kind regards,
David
I had noticed that when entering values for "S5" in my simu there was no way to simply jump to "S6" by pressing tab. The next field that gets activated is "Ang".
Good pickup - thanks. The tab sequence was originally configured to bypass those horn segment input boxes that are auto-populated. I overlooked updating this arrangement when the Compound Horn option was added. It should be possible for me to fix this in the next day or so.
In the "max SPL plots" the feature to compare with previous simu seems to be not working correctly - the previous trace is way down.
To compare Maximum SPL plots from two different records it is necessary to use the 'Compare Captured' rather than the 'Compare Previous' option. This is because the previous result will be the default SPL plot of the second record rather than the Maximum SPL plot of the first record - which is why your previous trace is way down compared to the Maximum SPL plot of the second record. See the Compare tool description on page 12 of the Hornresp Help file for details on how to capture and release results.
By the way - is there a feature to overlay several traces of different simus - not just two?
Sorry, no 🙂.
Kind regards,
David
I cannot log on to the Hornresp site. Heck if I know what I'm doing wrong. I keep getting server time outs.
Mark
Mark
I cannot log on to the Hornresp site. Heck if I know what I'm doing wrong. I keep getting server time outs.
Hi Mark,
Just checked - Hornresp still works okay for me.
Kind regards,
David
David, I gave the "capture feature" a try to overlay max SPL plots, but didn't succeed.
I did it both ways with right click and with strg-c / strg-x. Could you please check back?
One more question:
is there a way to set "combined response" together with a certain "path length" as permanent for a certain simu ?
Michael
I did it both ways with right click and with strg-c / strg-x. Could you please check back?
One more question:
is there a way to set "combined response" together with a certain "path length" as permanent for a certain simu ?
Michael
Hi Michael,
Could you please try the following example:
1. Calculate normal SPL for default record 1.
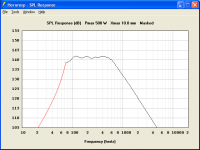
2. Calculate Maximum SPL with Pmax = 500 and Xmax = 10.0 - see Attachment 1.
3. Capture current results.
4. Re-calculate normal SPL for default record 1.
5. Calculate Maximum SPL with Pmax = 9999 and Xmax = 99.9.
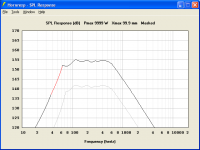
6. Compare captured result to current result - see Attachment 2.
Do you get similar results to me?
Sorry, no 🙂.
Kind regards,
David
I gave the "capture feature" a try to overlay max SPL plots, but didn't succeed. I did it both ways with right click and with strg-c / strg-x.
Could you please try the following example:
1. Calculate normal SPL for default record 1.
2. Calculate Maximum SPL with Pmax = 500 and Xmax = 10.0 - see Attachment 1.
3. Capture current results.
4. Re-calculate normal SPL for default record 1.
5. Calculate Maximum SPL with Pmax = 9999 and Xmax = 99.9.
6. Compare captured result to current result - see Attachment 2.
Do you get similar results to me?
Is there a way to set "combined response" together with a certain "path length" as permanent for a certain simu?
Sorry, no 🙂.
Kind regards,
David
Attachments
Last edited:
Hornresp Update
Hi Michael,
The tab order for Compound Horns has been changed - Product Number 2800-100815 refers. Thanks again for the feedback.
Kind regards,
David
I had noticed that when entering values for "S5" in my simu there was no way to simply jump to "S6" by pressing tab. The next field that gets activated is "Ang".
Hi Michael,
The tab order for Compound Horns has been changed - Product Number 2800-100815 refers. Thanks again for the feedback.
Kind regards,
David
- Home
- Loudspeakers
- Subwoofers
- Hornresp