Hornresp Update 5070-200327
Hi Everyone,
CHANGE 1
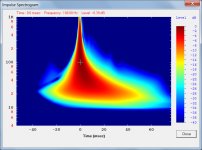
The impulse spectrogram frequency range now changes from 40-10000Hz to 4-1000Hz when the 1-2000Hz main chart frequency range is selected. Post #10552 and Attachment 1 refer.
CHANGE 2
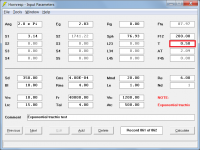
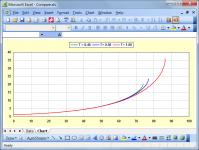
Horn flare parameter T has been added to the spherical wave horn model. T can have a value between 0.4 and 1, with 1 specifying a standard spherical wave horn, 0.5 specifying an exponential tractrix or "JMMLC tractrix revisited" horn, and any other value in the range specifying a user-defined custom profile. Post #10563 and Attachments 2, 3 and 4 refer.
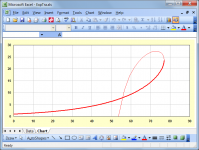
The thin red trace in Attachment 4 shows the 'JMMLC tractrix revisited' profile originally produced in Excel by Jean-Michel. The thick red superimposed trace shows the identical Hornresp-generated 'exponential tractrix' profile.
CHANGE 3
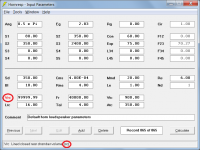
Double-clicking on the Vrc label in edit mode now changes the unit of volume for the rear chamber from litres to cubic centimetres. This option was requested by a user who is currently working on a horn design for microspeakers, having very small back chamber volumes. Attachment 5 refers.
As always, please report any bugs.
Stay safe,
David
Hi Everyone,
CHANGE 1
The impulse spectrogram frequency range now changes from 40-10000Hz to 4-1000Hz when the 1-2000Hz main chart frequency range is selected. Post #10552 and Attachment 1 refer.
CHANGE 2
Horn flare parameter T has been added to the spherical wave horn model. T can have a value between 0.4 and 1, with 1 specifying a standard spherical wave horn, 0.5 specifying an exponential tractrix or "JMMLC tractrix revisited" horn, and any other value in the range specifying a user-defined custom profile. Post #10563 and Attachments 2, 3 and 4 refer.
The thin red trace in Attachment 4 shows the 'JMMLC tractrix revisited' profile originally produced in Excel by Jean-Michel. The thick red superimposed trace shows the identical Hornresp-generated 'exponential tractrix' profile.
CHANGE 3
Double-clicking on the Vrc label in edit mode now changes the unit of volume for the rear chamber from litres to cubic centimetres. This option was requested by a user who is currently working on a horn design for microspeakers, having very small back chamber volumes. Attachment 5 refers.
As always, please report any bugs.
Stay safe,
David
Attachments

Hi David!
I have a question😀
I have simulated a TABAQ with the Hornesp and then I have developed a tapered version by using the size obtained from hornesp.
I have build the speaker and measured it. I obtain a huge differences in the response.🙁
In the forum I read that sentence:
When you folded the transmission line enclosure it will change cross section area bigger and Line length shorter than origional design. Maybe these two cause affect the bass. So i decide to buy Martin's worksheet to recaculate SPL curve.
Is it possible to take in account this phenomenom in Hornesp?
Thank you very much 😀
Is it possible to take in account this phenomenom in Hornesp?
That's a big ask. Hornresp currently does not off a feature that allows you to model the physical folding of an enclosure.
I use the "BOXPLAN" workbooks (available off my website) to do that. Perhaps there's one that that's close to what you built.
FWIW, minor path length errors are not going to make that much difference to a response curve. If the measured response of your build is noticeably off of the sim'd response curve, then that either means that what was built was not what was sim'd. Either the dimensions are off, or the driver parameters are off.
I think that depend, because in my case I have put a 60cm MLTL in a relatively small box, therefore there are many 90° angle compared with the length of TL.
I have a high 100-150Hz peak, that is an effect if the TL is shorter but with big cross-section🙁
Hi Bambinz,
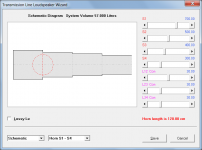
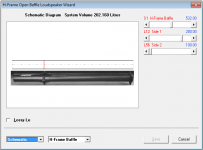
It is up to the user to decide how folding impacts on the cross-sectional area and overall length. Four segments can be specified in Hornresp, and if the 'stepped segments' option is selected there can be abrupt changes of cross-sectional area at the segment interfaces, as shown in the attachment. It should be possible to specify a folded transmission line system to an acceptablee degree of accuracy in Hornresp.
That should not be the case. Something is obviously wrong somewhere. Hornresp transmission line loudspeaker predictions are normally reasonably close to the measured results.
Stay safe,
David
Is it possible to take in account this phenomenom in Hornesp?
It is up to the user to decide how folding impacts on the cross-sectional area and overall length. Four segments can be specified in Hornresp, and if the 'stepped segments' option is selected there can be abrupt changes of cross-sectional area at the segment interfaces, as shown in the attachment. It should be possible to specify a folded transmission line system to an acceptablee degree of accuracy in Hornresp.
I obtain a huge differences in the response.
That should not be the case. Something is obviously wrong somewhere. Hornresp transmission line loudspeaker predictions are normally reasonably close to the measured results.
Stay safe,
David
Attachments
How folding impacts on the cross-sectional area and overall length? So I can verify if my response is correct or not 🙂
Thank you very much! And thank you again for you amazing software David 🙂
Thank you very much! And thank you again for you amazing software David 🙂
How folding impacts on the cross-sectional area and overall length? So I can verify if my response is correct or not 🙂
That is for you to work out, depending on how the system has been folded. It helps to be able to visualise things in three dimensions 🙂.
Brian's BOXPLAN worksheets may give you a few ideas:
The Subwoofer DIY Page - Horn Folding
The following may also be of interest:
The Subwoofer DIY Page - Transmission Line Systems
Probably I know the answer xD Do you will implement this functionality in hornesp?
Now I will read the amazing website of Brain Steele! 😀
Thank you very much at both for the sharing of your experiences and your softwares!!
Now I will read the amazing website of Brain Steele! 😀
Thank you very much at both for the sharing of your experiences and your softwares!!
Do you will implement this functionality in hornesp?
If you mean implementing something like Brian's BOXPLAN functionality in Hornresp, then the answer is no.
Always on the move! I'm still working on evaluating Update 5060 from Post #10541 😱Hornresp Update 5070-200327
...As always, please report any bugs.
I may have run into a minor bug, and have a question concerning the polar pattern plotter for H-frame/U-frame dipoles.
First the bug. Back in Update 5040 from Post #9902, the location of the acoustic centers could be shown by double clicking on the diagram. Hitting the Esc key would hide them. With the latest updates, once you have double clicked to show the acoustic centers, you can’t seem to hide them without restarting Hornresp. The Esc key just closes the Wizard window. Also, while I am thinking about it, was it intentional to hide the filling when the acoustic centers are displayed?
Concerning the polar pattern plotter: If you have selected “Combined” power response from within the Wizard, the polar patter displayed is what I expect for a combination of 2 sources. If “Output 1” or “Output 2” power response is selected, a different polar pattern is displayed. Can you share what the other pattern represent? Thanks!
Last edited:
Thought I might share a few examples of how the H-frame/U-frame Polar plotter can be used.
First, I revisited the Bose Wave Cannon that had been modeled with Hornresp back in 2016. Bose Wave Cannon
Some discussion involved what direction the “hot” side of the response was on. The conclusion was the best listening axis was perpendicular to the length of the tube; it is NOT a cannon at all. The new polar plotter capability makes this determination much easier.
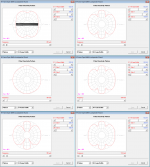
Attachment #1: Hornresp model of the cannon as an extremely extended H-frame.
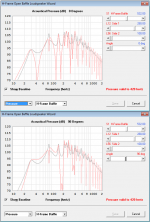
Attachment #2: Response at 0deg and 90deg makes it obvious why the listening axis would be broadside to the tube.
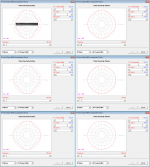
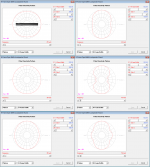
Attachment #3 , #4, & #5: Polar Plots from 25Hz – 100Hz in 5Hz increments.
Attachment #6: A zip file containing a *.wmv movie file showing the polar pattern gain “petals” as you scroll up in frequency…kind of mesmerizing to watch.
First, I revisited the Bose Wave Cannon that had been modeled with Hornresp back in 2016. Bose Wave Cannon
Some discussion involved what direction the “hot” side of the response was on. The conclusion was the best listening axis was perpendicular to the length of the tube; it is NOT a cannon at all. The new polar plotter capability makes this determination much easier.
Attachment #1: Hornresp model of the cannon as an extremely extended H-frame.
Attachment #2: Response at 0deg and 90deg makes it obvious why the listening axis would be broadside to the tube.
Attachment #3 , #4, & #5: Polar Plots from 25Hz – 100Hz in 5Hz increments.
Attachment #6: A zip file containing a *.wmv movie file showing the polar pattern gain “petals” as you scroll up in frequency…kind of mesmerizing to watch.
Attachments
Another example where the polar plotter comes in handy is in evaluating U-frame designs where a cardiod or hyper-cardiod polar response is desired. A cardiod response is achieved when 2 sources that are 180deg out of phase with each other are spaced apart and one source is delayed by the separation distance. More details can be found on the Linkwitz, archived JohnK, or Kimmo Saunisto websites.
H-U frame woofers
DIY-dipole-1
Cardioid bass
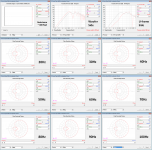
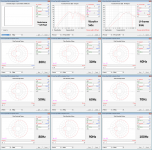
With U-frames, the tube provides the source separation and the front and rear radiation of the woofer are inherently out of phase. To provide the delay acoustically, the best choice is to insert an acoustic resistance screen right at the exit of the tube. The resistance combined with the acoustic compliance of the air in the tube provides a substantially constant delay in the bass range. If anybody is interested, I can share more of the details for calculating the desired acoustic resistance for a given U-frame length to optimize the cardiod polar response across as broad a frequency range as possible. To insert an acoustic resistance with Hornresp, you fill the last 1% of the tube with a high density of filling. The equivalent acoustic resistance is equal to the filling setting x the length of filling in the tube in meters. For the example shown in Attachment #1 we have Filling in Segment 4 of 80,000, and the length of filling of 0.6cm. So, acoustic resistance is 80000*(0.6/100) = 480 Rayl. Acoustic resistances in this range can easily be constructed with thin felt and perforated or slotted panels.
Attachment #1: Hornresp model and polar plots for a U-frame subwoofer with a Peerless SLS-12 woofer. Near uniform Hyper-cardiod response is provided across the bass range using an acoustic resistance of about 480 Rayl.
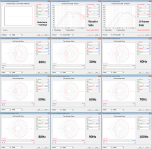
Attachment #2 & #3: For comparison, here are bracketing plot sets for 420 Rayl and 540 Rayl.
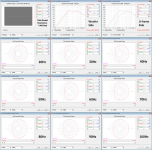
The alternative to using acoustic resistance for generating delay is the more traditional filling approach as often used in TL enclosures. However, the delay isn’t as constant as the acoustic resistance approach and the magnitude of the response is also attenuated non-uniformly with frequency. You can achieve a fair amount of reduction in rearward radiation, but not near what is achieved with acoustic resistance.
Attachment #4: Best compromise cardiod response I could achieve over the bass range using uniform filling.
H-U frame woofers
DIY-dipole-1
Cardioid bass
With U-frames, the tube provides the source separation and the front and rear radiation of the woofer are inherently out of phase. To provide the delay acoustically, the best choice is to insert an acoustic resistance screen right at the exit of the tube. The resistance combined with the acoustic compliance of the air in the tube provides a substantially constant delay in the bass range. If anybody is interested, I can share more of the details for calculating the desired acoustic resistance for a given U-frame length to optimize the cardiod polar response across as broad a frequency range as possible. To insert an acoustic resistance with Hornresp, you fill the last 1% of the tube with a high density of filling. The equivalent acoustic resistance is equal to the filling setting x the length of filling in the tube in meters. For the example shown in Attachment #1 we have Filling in Segment 4 of 80,000, and the length of filling of 0.6cm. So, acoustic resistance is 80000*(0.6/100) = 480 Rayl. Acoustic resistances in this range can easily be constructed with thin felt and perforated or slotted panels.
Attachment #1: Hornresp model and polar plots for a U-frame subwoofer with a Peerless SLS-12 woofer. Near uniform Hyper-cardiod response is provided across the bass range using an acoustic resistance of about 480 Rayl.
Attachment #2 & #3: For comparison, here are bracketing plot sets for 420 Rayl and 540 Rayl.
The alternative to using acoustic resistance for generating delay is the more traditional filling approach as often used in TL enclosures. However, the delay isn’t as constant as the acoustic resistance approach and the magnitude of the response is also attenuated non-uniformly with frequency. You can achieve a fair amount of reduction in rearward radiation, but not near what is achieved with acoustic resistance.
Attachment #4: Best compromise cardiod response I could achieve over the bass range using uniform filling.
Attachments
Last edited:
Hi bolserst,
Many thanks for reporting this bug. The code that hides the acoustic centres has completely disappeared! It seems that I must have inadvertently deleted it when I was making other changes 🙂. It will be reinstated in the next update.
For some reason I decided not to show the filling material, but I have no idea why 🙂. The code is already there - it is just a matter of activating it. This will be done in the next release.
Oops, something I completely overlooked 🙂. Without going into the gory details as to how and why it happens, the other pattern is constructed using the side 1 and side 2 pressures and phases at ~2000 Hz (or at ~20000 Hz if the chart scale is changed), regardless of the selected frequency. In other words, the pattern is essentially meaningless 🙂. To avoid any confusion I think it would be best to show the pattern for the two sources at all times, independent of the power response setting. This will be implemented in the next update.
Many thanks for the excellent feedback!
Stay safe,
David
With the latest updates, once you have double clicked to show the acoustic centers, you can’t seem to hide them without restarting Hornresp. The Esc key just closes the Wizard window.
Many thanks for reporting this bug. The code that hides the acoustic centres has completely disappeared! It seems that I must have inadvertently deleted it when I was making other changes 🙂. It will be reinstated in the next update.
was it intentional to hide the filling when the acoustic centers are displayed?
For some reason I decided not to show the filling material, but I have no idea why 🙂. The code is already there - it is just a matter of activating it. This will be done in the next release.
If “Output 1” or “Output 2” power response is selected, a different polar pattern is displayed. Can you share what the other pattern represents?
Oops, something I completely overlooked 🙂. Without going into the gory details as to how and why it happens, the other pattern is constructed using the side 1 and side 2 pressures and phases at ~2000 Hz (or at ~20000 Hz if the chart scale is changed), regardless of the selected frequency. In other words, the pattern is essentially meaningless 🙂. To avoid any confusion I think it would be best to show the pattern for the two sources at all times, independent of the power response setting. This will be implemented in the next update.
Many thanks for the excellent feedback!
Stay safe,
David
Last edited:
Thought I might share a few examples of how the H-frame/U-frame Polar plotter can be used.
Another example where the polar plotter comes in handy is in evaluating U-frame designs where a cardiod or hyper-cardiod polar response is desired.
Many thanks for the detailed analyses!
Very interesting indeed, and very nicely presented 🙂.
If anybody is interested, I can share more of the details for calculating the desired acoustic resistance for a given U-frame length to optimize the cardiod polar response across as broad a frequency range as possible.
Yes please!
- Home
- Loudspeakers
- Subwoofers
- Hornresp