Thanks for the 3 replies!
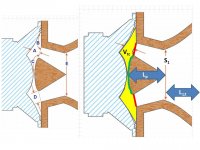
Using a schematic from the link provided by mwmkravchenko I worked on the attached. It's the simplest phase plug noted in that link, and one that reportedly was used to crossover at 2.5kHz (like me) although on an 8" instead of my 5".
Left and right schematics are the same, but on the right one I noted what I'm thinking Vtc, Atc, Ap1, Lp, S1 and L12 are. This is to confirm with you I'm getting it right.
Vtc is clear to me is the yellow surface. I'm not sure which one is Atc and which is Ap1... Atc is the red lines, and Ap1 is the green line?
Attachments
BTW, I simmulated along the lines of the above, but found out I can get Acoustical Power plotted, but can't get Directivity to work. How can I know what kind of SPL response I would get?
I would take the red lines in your figure as S1 as the cone phase plug gives you a monotonic flare rate out to what you've labelled S1. If you reread the previously linked article, you will find it agrees with me. It probably also gives you a better result
Directivity information given in hornresp is independent of the throat chamber detail, so I'd model the horn on its own under the assumption you are going to take care of the phase plug yourself.I can get Acoustical Power plotted, but can't get Directivity to work.
Sprong!
It has been a long while since I have seen one of these. WHG
It's not a practical physical design - just because it can be drawn in the form shown, doesn't necessarily mean that it can be built.
It has been a long while since I have seen one of these. WHG
Vtc is clear to me is the yellow surface. I'm not sure which one is Atc and which is Ap1... Atc is the red lines, and Ap1 is the green line?
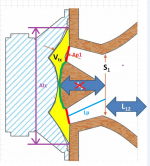
Atc is the average cross-sectional area of the throat chamber, normal to the horn axis. For the purposes of the simulation it is usually assumed to be equal to Sd.
Ap1 is the total sum of the areas represented by the red lines.
The green line shown is not applicable and can be ignored.
Lp is the axial length down the air passage from the red Ap1 line to the S1 line.
Attachments
Last edited:
I would take the red lines in your figure as S1
See previous Post #6227.
Directivity information given in hornresp is independent of the throat chamber detail, so I'd model the horn on its own under the assumption you are going to take care of the phase plug yourself.
This is the correct approach to take.
This is the correct approach to take.
Thanks again for the replies.
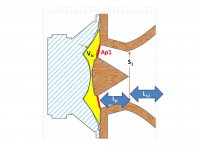
Attached is my updated interpretation. Did I get Lp right on attachment #1?
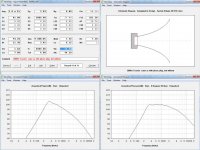
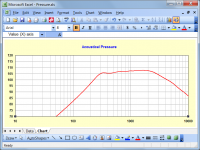
Attachments #2 and #3 display the same horn (S1, L12, profile, S2), same driver and rear chamber, but #2 has no phase plug and #3 does have it.
My understanding is the bottom right graph on attachment #2, the acoustical pressure, best predicts the response the speaker will have. Meaning, it's a simulation of the SPL I would measure in room as a function of frequency. I included acoustical power too. What does acoustical power mean, though?
Then I include the phase plug in #3 and plot the acoustical power. What does it tell me? There is a discontinuity at 2.5kHz approx that can't be good, but beyond that...is it better than the model without phase plug?
Thanks all for the patience you have with me! 😱
Attachments

^^ Waiting to see answers to Lewinski !
Because from what i understand, I'm on a similar way, 70-2500cm2 45cm lenght...2 segment hyperbolic , 4" speaker. After beeing too confident and enthousiast with Akabak high freq sims, i reconize better my first measurement result with hornresp (simplified to 1 segment) directivity sims ! I didn't really realized the difference between pressure/power, and just opted to akabak without understanding until now the not so subtil subtility...and so, i will have hard but funny time with phase plug + passive eq, and go back to my favorit toy, hornresp ^^.
Because from what i understand, I'm on a similar way, 70-2500cm2 45cm lenght...2 segment hyperbolic , 4" speaker. After beeing too confident and enthousiast with Akabak high freq sims, i reconize better my first measurement result with hornresp (simplified to 1 segment) directivity sims ! I didn't really realized the difference between pressure/power, and just opted to akabak without understanding until now the not so subtil subtility...and so, i will have hard but funny time with phase plug + passive eq, and go back to my favorit toy, hornresp ^^.
Did I get Lp right on attachment #1?
Lp is the axial length of the phasing air passage. That is, the length of the light blue line shown in the attachment to Post #6227.
What does acoustical power mean, though?
Google 'acoustic power vs acoustic pressure'.
Then I include the phase plug in #3 and plot the acoustical power. What does it tell me?
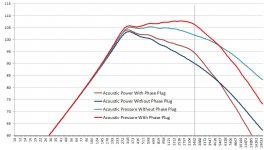
If you compare the acoustical power responses with and without the phase plug, you will see that HF power response with phase plug is superior, which means that the HF pressure response with phase plug will be also be better than that calculated for the "without phase plug" case.
The "with phase plug" pressure response can be constructed by:
1. Exporting the chart data for the three responses shown in your attachments.
2. Subtracting the "without phase plug" power response from the "without phase plug" pressure response to obtain the difference due to directivity.
3. Adding the directivity difference to the "with phase plug" power response to obtain the "with phase plug" pressure response.
The constructed "with phase plug" pressure response is attached. The Resonances Masked option has been used.
There is a discontinuity at 2.5kHz approx that can't be good,
The discontinuities are due to resonances in the rear chamber. The resonances are no longer being damped because Fr and Tal have been changed to Ap1 and Lp. Lrc is specified as 7 cm which means that the first half-wavelength resonance occurs at (34400 / 7) / 2 = 2457Hz, the second at 4914Hz, and so on.
Assuming that in practice the rear chamber will be lined, then for the purposes of the simulation the resonances can be "removed" by reducing Lrc to say 1 cm, or by switching to the Resonances Masked option.
but beyond that...is it better than the model without phase plug?
As far as the simulation results are concerned, it would seem so.
Attachments
Just to clarify - Hornresp is not aware that a phase plug has been specified. The difference in the simulated responses with and without the phase plug is not due to a change in the phase conditions at the throat, rather, it is a result of including a short rapidly flaring conical segment before the main tractrix horn, making Ap1 rather than S1 the effective throat area. The upper frequency efficiency is increased mainly because Ap1 is significantly smaller than S1.
David,
Once again I want to thank you for the time you spend explaining to me. Your post #6232 was very clear and helpful. I've gone back and ran the numbers again and followed your procedure and I got it. That is, I got the procedure 🙂
Not sure my understanding has reached the point to fully grasp what you are implying here, though. I'll probably get there, in time.
Here's how the simulation is looking like for me now. The phase plug introduces a rising improvement in efficiency that peaks at 4.6dB @ 2300Hz and is 4.3dB @ 2500Hz. Looks better than without phase plug. I guess next step is to fine tune the calculation of the key parameters (I just threw in a figure for Vtc and used a plug that was designed for another driver, after all).
Once again I want to thank you for the time you spend explaining to me. Your post #6232 was very clear and helpful. I've gone back and ran the numbers again and followed your procedure and I got it. That is, I got the procedure 🙂
Just to clarify - Hornresp is not aware that a phase plug has been specified. The difference in the simulated responses with and without the phase plug is not due to a change in the phase conditions at the throat, rather, it is a result of including a short rapidly flaring conical segment before the main tractrix horn, making Ap1 rather than S1 the effective throat area. The upper frequency efficiency is increased mainly because Ap1 is significantly smaller than S1.
Not sure my understanding has reached the point to fully grasp what you are implying here, though. I'll probably get there, in time.
Here's how the simulation is looking like for me now. The phase plug introduces a rising improvement in efficiency that peaks at 4.6dB @ 2300Hz and is 4.3dB @ 2500Hz. Looks better than without phase plug. I guess next step is to fine tune the calculation of the key parameters (I just threw in a figure for Vtc and used a plug that was designed for another driver, after all).
Attachments
Hi,
I got a decimal input problem/bug. I know it's maybe a problem relative to the fact that i run hornresp with Wine on a Linux plateform, but maybe someone know how to resolve my problem.
So, my laptop used when travelling is running on a linux mint, and i run hornresp on it via Wine. But each time i enter a parameter number value manually, there's a problem. If i put a integer, either it work normally, or the value that appear when i push "enter" is multiplied by 100. Selecting the wizard can result in multipling a value too, often Eg, or Ang. And putting decimal doesn't work at all, and are in all cases multiplied by 100.
So i got Ang=20,0...and it works as if it where possible, giving some weird results...
Importing records, each cells are multiplied by 100, except Ang, util i select another cell, so it became 20,0 instead of 2,0.
So i can still use sliders to put more or less correct values in the wizard, but for rms calcul i still need hornresp to work normally.
Since my son is hospitalized for 2 week, i'm not at home, and i would have been really happy to play hornresp/akabak on the evenings.
Thx !
Not sure my understanding has reached the point to fully grasp what you are implying here, though.
Just that it might be possible to achieve the desired "improved response" without the need for a phase plug in the horn you actually build. Instead, simply include an initial conical segment similar to the one specified in the simulation.
I got a decimal input problem/bug. I know it's maybe a problem relative to the fact that i run hornresp with Wine on a Linux plateform, but maybe someone know how to resolve my problem.
Google 'Hornresp with Wine'.
when an isophase wavefront model is used, such as with a Le Cléac'h horn, there is no longer a linear relationship between the value of Ang and wavefront area because the wavefronts are curved.
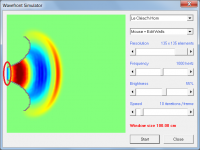
The help file notes that the wavefront simulator uses an isophase model. It appears to model diffraction. What is the wavefront angle at the throat?Webster plane wavefront model and does not take the "bubble" into account. The Hornresp isophase wavefront model does.

What is the wavefront angle at the throat?
Hi AllenB,
Because the driver diaphragm is modelled as a rigid plane circular piston, the wavefronts for both the Wavefront Simulator tool and the isophase wavefront simulation model are assumed to be planar at the horn throat entry point, as shown in the attachment.
Kind regards,
David
Attachments
Last edited:
- Home
- Loudspeakers
- Subwoofers
- Hornresp