....Generally you'd expect to see the tweeter's phase near 0 at high frequencies after you remove the delay.
This is not correct. At high frequency the tweeter phase should approach approximately 90 times the order of the tweeter high frequency roll off. The real phase response presented look very reasonable.One point about the phase at low frequency. This is extremely sensitive the the slope associated with the high pass nature of the lower frequency range, and as the level gets low it is difficult to get actuate measurements. Phase gets contaminated by noise.
Yeah, that was a goof which I corrected in the next post. I meant to say the excess phase, not the real phase, should be near zero with correct polarity and near +/-180 with inverted polarity.
- Ummm, Pano,,, are you going to post any measurements of your own stuff ?
Yes, after I get back from RMAF. Been far too busy to do any horn measuring - sorry. 😱
Hello J-M
Thanks very much for posting those curves .
In particular, the Group Delay curves you've attached are quite interesting .
- Most wouldn't be looking at the "before & after EQ" with quite the same perspective as myself ( since the DUT is mine ) .
- Others might miss the reduction ( flattening ) in "GD" centered around 3100 hz ( or 3200 hz ) and wouldn't be able to guess at it's signifcance ( & why ) .
- It just so happens that this is the frequency area that I've attenuated with a series LCR ( strapped across the drivers' terminals ) .
- LCR values ( not tested ) are 2.6 mH , 1 uF , 8 ohms ( if they're "book values", the notch is centered at 3121 hz ).
- I believe this is the first time I've seen an LCR notch filter effect the group delay like this ( though I'll admit I haven't looked at it with the type of resolution that you just employed / plus , I usually look to CSDs for indications that LCRs might be inhibiting ringing ) .
- This was a real eye-opener . So Thanks again !
>< cheers 🙂
Last edited:
EarlK said:- Ummm, Pano,,, are you going to post any measurements of your own stuff ?
panomaniac said:Yes, after I get back from RMAF. Been far too busy to do any horn measuring - sorry.
Okay, cool, have fun !
>< EarlK
Just to pick up this thread again - I found some interesting things when measuring horns for the $$Horn Honk$$ thread. I posted them over there, too.
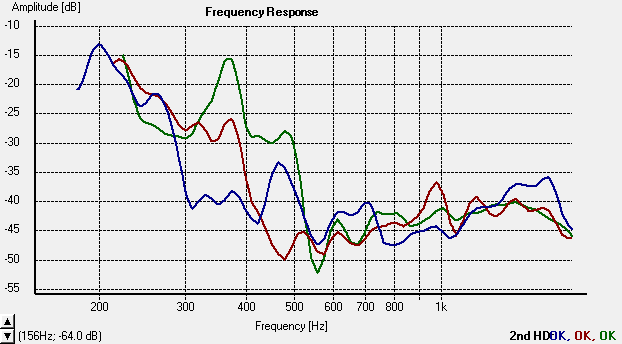
Basically I noticed that each horn showed a very steep rise in 2nd harmonic distortion below a certain point. The larger the horn, the lower that point.
Posted below is a graph that shows the 2nd harmonic distortion of 3 horns.
The steep rise in the second harmonic corresponds almost exactly to the wavelength of the width of each horn. Or a 1/2 wavelength of the fundamental.
3rd and 4th order harmonics also showed a rise, but not as clear cut. The distortion is easy to hear when doing a sweep.
So if we call horn "cut-off" the frequency at which the 2nd harmonic jumps up, and we stay an octave above that, then I would call the horns:
On the graph below Blue = 511, Red = 811, Green = Dayton H812
Basically I noticed that each horn showed a very steep rise in 2nd harmonic distortion below a certain point. The larger the horn, the lower that point.
Posted below is a graph that shows the 2nd harmonic distortion of 3 horns.
- Altec 511 (nominally 500Hz horn)
- Altec 811 (nominally 800Hz horn)
- Dayton H812 (nominally 800Hz horn)
The steep rise in the second harmonic corresponds almost exactly to the wavelength of the width of each horn. Or a 1/2 wavelength of the fundamental.
3rd and 4th order harmonics also showed a rise, but not as clear cut. The distortion is easy to hear when doing a sweep.
So if we call horn "cut-off" the frequency at which the 2nd harmonic jumps up, and we stay an octave above that, then I would call the horns:
- 511 = 600Hz horn
- 811 = 800Hz horn
- Dayton = 1Khz horn
On the graph below Blue = 511, Red = 811, Green = Dayton H812
And "cutoff" is defined how? By the manufacturer?
2nd harmonic, as a percentage, is always going to go up below cutoff because the fundamental is droping, but twice it is stll in the passband.
2nd harmonic, as a percentage, is always going to go up below cutoff because the fundamental is droping, but twice it is stll in the passband.
Yes, by the manufacturer. Horns are usually sold with a lowest cut-off stated and sometimes a lowest recommended crossover.
So without measuring or listening, how are we to know how low a horn may really be used? Below what frequency will it "sound bad"? And below what frequency will directivity suffer? Altec used to supply plots like this in their datasheets.
Running the sweeps that resulted in these measurements the distortion at the low end was easy to hear. All these sweeps were done with a Butterworth 2nd order HP @ 400Hz. As the sweep climbed in frequency from down low, the sine would clean up at some point. Likely the point where the 2nd harmonic (and others) drops. I would not want much of that distorted sound in my system.
So I certainly agree that crossing 1 octave above that point, the distortion will still be in the passband for normal crossover slopes. How much it's audible you will know much better than I. But looking at the 811 plot above, the 2nd harmonic is about 6-8dB above its average bandpass level at 400Hz. With a 2nd order high pass, at least you'd be bringing it down that much. As a percentage tho, it would continue to rise.
I don't think that HOLM shows the distortion on these plots as a percentage, but as an absolute value.
Hello Panomaniac,
You'll find on that page :
Electroacoustique Comparaison de pavillons 2''
measurements (on and off axis response, impulse response, distortion, CSD...) performed by Cyrille Pinton on a JBL2445 compression driver mounted on various horns one of those is a Le CLéac'h horn having and Fc of 320Hz which was commercialized few times ago by my friend Marco Henry (Musique Concrète) under the reference Jerzual 322:
(take care the graphs are animated gifs with a few second time lapse between diplaying a different horn)
Apart the Jerzual / Le Cléac'h horn you can see the JBL 2380A and the Beyma TD-400 , see picture at:
http://cyrille.pinton.free.fr/electroac/experiences/pavillons-2445j/pavillons.jpg
You may see that only the Le Cléac'h horn maintains more than 10dB difference between H2 and H3 above 650Hz.
You'll see also that the diferent horns have different rise in distortion near the acoustical cut-off (when the diapragm is no more acoustically loaded by the horn)
Best regards from Paris, France
Jean-Michel Le Cléac'h
Last edited:
Thanks J-M! I was just over there looking at those. I see the same rise in distortion as the horn "unloads" at the low end. So my measurements are probably valid.
Cyrille's measurements show the distortion rise point = the horn mouth width, too
Funny, I don't remember seeing this in any horn or driver datasheet. Will have to look closer...
Ah ha! The JBL docs do show it.
Cyrille's measurements show the distortion rise point = the horn mouth width, too
Funny, I don't remember seeing this in any horn or driver datasheet. Will have to look closer...
Ah ha! The JBL docs do show it.
Hi Pano,
In case you missed it earlier / here's the distortion spec for my Altec 288-8K on the Emilar EH500-2 ( as captured by "STEPS" ) .
First pic is without passive EQ or High-Pass in place / the second pic is after the HP & RC contour circuit have been added .
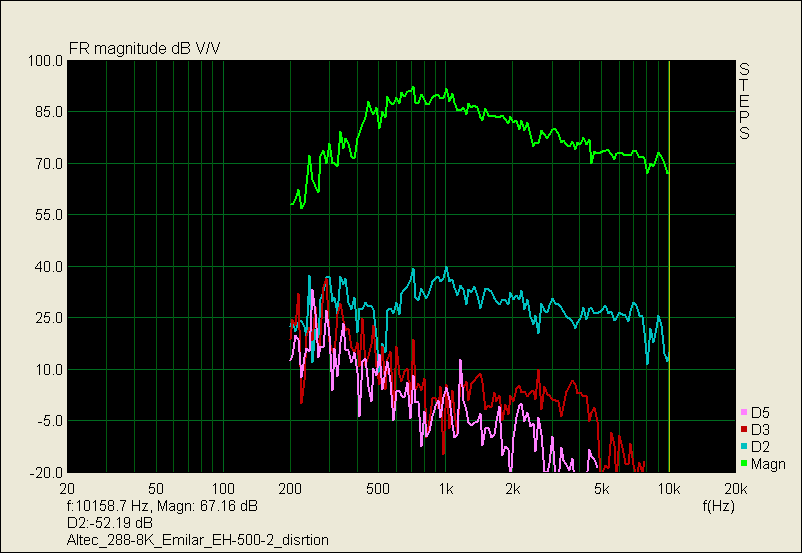
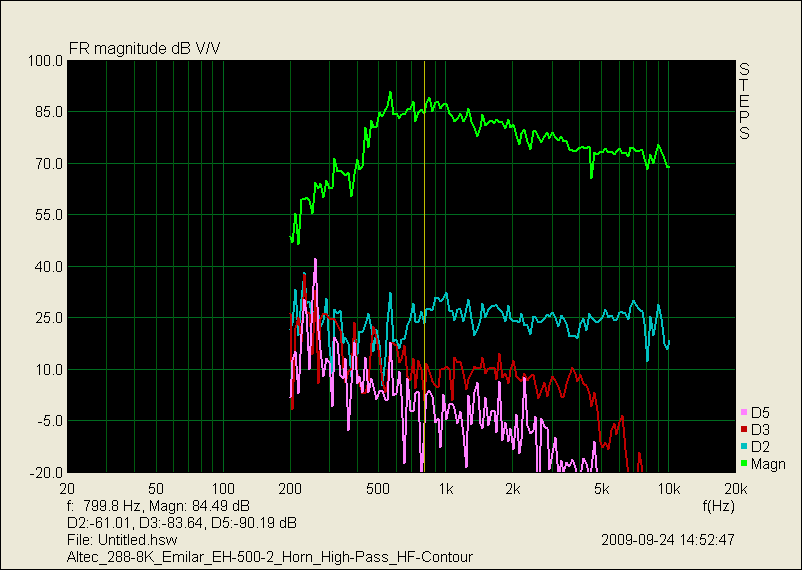
One can see the effect of padding down the midrange ( 2nd HD & 3rd HD become closer together , fwiw ) .
The passive EQ was implemented to give this on axis response .

<> cheers 🙂
PS ; Thanks for that link J-M !
In case you missed it earlier / here's the distortion spec for my Altec 288-8K on the Emilar EH500-2 ( as captured by "STEPS" ) .
First pic is without passive EQ or High-Pass in place / the second pic is after the HP & RC contour circuit have been added .
One can see the effect of padding down the midrange ( 2nd HD & 3rd HD become closer together , fwiw ) .
The passive EQ was implemented to give this on axis response .
<> cheers 🙂
PS ; Thanks for that link J-M !
Attachments
Thanks Earl. It's interesting that I don't see the abrupt distortion rise at the low end of your graphs. Wonder why?
I hope to have some 288 plots next week.
I hope to have some 288 plots next week.
More on minimum phase behavior in that other thread. The BMS 4550 and the QSC 90x60 are close enough to minimum phase in the passband to not worry about it.
http://www.diyaudio.com/forums/multi-way/161627-horn-honk-wanted-53.html#post2140643
About the distortion plots. ARTA (STEPS) and HOLM do them differently. ARTA plots the absolute level of the fundamental and the harmonic. HOLM plots how far the harmonic is below the fundamental. HOLM will show a rise in distortion below the cutoff and ARTA will not. If you have ARTA plot % distortion rather than dB, the plots will look similar.
Doug did some THD plots in HOLM and it looks like it's really THD+noise. Different graphs using different electrical filters, pick any point on them and the sum of the fundamental and the THD is the same, implying a low volume measurement and a constant noise level. Pretty graphs with no meaning.
An externally hosted image should be here but it was not working when we last tested it.
Doug did some THD plots in HOLM and it looks like it's really THD+noise. Different graphs using different electrical filters, pick any point on them and the sum of the fundamental and the THD is the same, implying a low volume measurement and a constant noise level. Pretty graphs with no meaning.
There is some noise in the THD curves from Holm, but its not the same as in the old days when THD was measured by notching out the fundamental and measuring what was left (which could often be all noise). The technique in HOLM is basically immune from noise. It seperates out each harmonic as a seperate impulse response that precedes the main one by different times. The curve being shown is the absolute level of each harmonic.
Depending on how Arta does the discriminator in the stepped method its results can either be equal to or worse than Holm, but they cannot be better.
This was all studied in some detail in an AES paper years ago and swept sine was the most robust against all form of error.
Sorry, I don't believe that. If that were true, Doug's HOLM curves would imply that applying a steeper electrical filter would increase the absolute level of the harmonics. That doesn't pass the smell test. I'm pretty sure the dB being plotted is the difference between the fundamental and the harmonics. Pick some points and add them. Fundamental + harmonics = -60dB almost anywhere you pick on any of the three curves.The curve being shown is the absolute level of each harmonic.
Edit: I don't believe that the distortion is that constant so that's why I said the distortion is probably buried down in the noise floor.
Last edited:
I tried another edit but it was too late.
Earl, you said the curves are three harmonics. Not so. The are all THD with three different electrical filters applied to the horn.
Earl, you said the curves are three harmonics. Not so. The are all THD with three different electrical filters applied to the horn.
I can't explain someone else's measurements, I just telling you how the measurement is done. You can believe it or not I really don't care. HOLM will give THD or individual harmonics. It can do either. But its NOT THD + noise unless the measurement was messed up. The distortion could be so low that its only noise, thats possible. But your comment
was inappropriate.Pretty graphs with no meaning.
I am curious about the way HOLM plots and displays distortion. The drop down menu gives Noise, THD, or any harmonic.
Also the distortion plot does not move if you adjust the FR offset. Shouldn't it follow the amplitude if it's relative?
Also the distortion plot does not move if you adjust the FR offset. Shouldn't it follow the amplitude if it's relative?
Earl, obviously I'm not the only one confused by the HOLM distortion measurements. You could clear it up by posting some THD measurements of your own -- a waveguide with and without a highpass filter. You appear to be saying that adding the HP filter will not increase the THD dB level at low frequencies. Others have posted measurements that disagree with this. I understand the theory in the papers but getting it done in code is another matter. 🙂
- Status
- Not open for further replies.
- Home
- Loudspeakers
- Multi-Way
- Horn cut-off distortions and phase