The offset most likely just changes how it's plotted. The HD plot is most likely based on the original values. Hey, I know next to nothing about HOLM's inner workings. I just know when I see plots that don't make sense -- like rising absolute distortion products down low in one program when another program (that I trust) doesn't show that.Also the distortion plot does not move if you adjust the FR offset. Shouldn't it follow the amplitude if it's relative?
Dennis
I don't do distortion measurements on speakers - the distortion numbers are meaningless, but the Holm plots are accurate. So I don't have any data to compare. I said before, I cannot explain your data. You might be correct that there is a bug in the program - but I will say that I have not caught Ask making any mistakes thus far so I'll have to go with my belief that the code is correct.
One of te things that attracrted me to Holm was the way it measures nonlinearities. Thats because it does it correctly, seperating out each individual harmonic and retaining accurate phase information relative to the fundamental. Virtually nothing else that I know of, and certainly nothing that is free, does this. That means that Holm could actually be used to give a distortion metric that was meaningful as opposed to THD etc. I looked into the techniques available for doing nonlinear measurements in quite a bit of detail and Holm is how I would do it. I checked the Holm resuilts in several cases and got plausible results so I have no reason to doubt its reliability.
Hence, all I would say to you at this point is, if you are interested in THD for a loudspeaker element (and that's the first thing that I would question) then you might want to consider why your measurement results don't fit with what you expect. In other words, if I were asked to place a bet, it would be that Holm is correct and its your understanding that is wrong.
Holm is not easy to master and understand, but it is a monumental piece of software that does everything right. Its the first time in almost 12 years that I have changed measurement software.
Can you show the individual harmonic impulses. That would dispel all controversy.
Thinking about it some more, that more or less proves it's relative. Say you have a 0dB fundamental and a -20dB harmonic. If you change it so the fundamental plots at +10dB but the harmonic doesn't change, it's telling you that the harmonic is still 20dB below the fundamental whatever the fundamental happens to read. There's nothing wrong with doing it that way, you just have to understand what the graph is telling you.Also the distortion plot does not move if you adjust the FR offset. Shouldn't it follow the amplitude if it's relative?
As far as I can tell, everything in HOLM is relative rather than absolute readings in dB SPL or dBV. Again, nothing wrong with that as long as you understand it.
BTW: ARTA can also do the Farina method and plot 2nd through 4th harmonics from the impulse response so HOLM isn't the only one. STEPS using stepped sines is still the generally preferred method and offers more options but it's much slower.
If you change it so the fundamental plots at +10dB but the harmonic doesn't change, it's telling you that the harmonic is still 20dB below the fundamental whatever the fundamental happens to read.
Doh! Head slap time. Yes, of course, make perfect sense. The amplitude is relative to 0dBFS, but the distortion is always relative to the amplitude (not 0dB). What was I thinking??
Here's ARTA plotting distortion with the Farina method. This is just a loop-back into my sound card with a signal strong enough to drive it into moderate clipping with a bit over 10% 3rd harmonic.

Same signal but with the impulse scaled up 20dB. The distortion products also move up 20dB. If you want relative measurements with the ARTA family, you have to use STEPS and tell it to plot % distortion rather than dB.

Same signal but with the impulse scaled up 20dB. The distortion products also move up 20dB. If you want relative measurements with the ARTA family, you have to use STEPS and tell it to plot % distortion rather than dB.
Attachments

Last edited:
.... Pretty graphs with no meaning.
An externally hosted image should be here but it was not working when we last tested it.
Hey now, they have meaning to me 😉 It means I can have a simple first order cap on the BMS4550/QSC 152i waveguide.
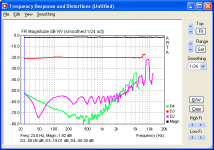
I was curious to with the THD+ Noise showed different slopes. The 2nd and 3rd order slopes (green and read) show higher Noise levels. Those slopes were set using the DCX. All have a LPAD (10dB 4.7ohms/5.1 ohms). The blue measurements is just a 4.7 Cap in series.
I can't explain someone else's measurements, I just telling you how the measurement is done. You can believe it or not I really don't care. HOLM will give THD or individual harmonics. It can do either. But its NOT THD + noise unless the measurement was messed up. The distortion could be so low that its only noise, thats possible. But your comment was inappropriate.
In the context of the discussion from the plots, I know what Catapult is saying. No meaning in terms THD issues for different slopes set in the DCX.
- Status
- Not open for further replies.
- Home
- Loudspeakers
- Multi-Way
- Horn cut-off distortions and phase