Looking for measurements that any of you may have of horns and waveguides near their low cut-off frequency.
Standard practice is to high pass the horn at least an octave above its cut-off frequency. Is this really needed at home hi-fi levels? Some say no.
So if you have phase, distortion and impulse measurements that you would like to share, please do. Let us know what the horn and driver are, if you can. Also point out what you think are the important parts of your measurements. Actual measurements are vastly preferred over simulations here. Simulations are OK if you can also show us the real measurements.
It will be interesting to see what horns are really doing down there. Thanks!
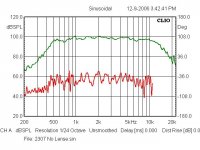
Wow! As I can see the FR extends well down to 500Hz! And they call that a 1.2kHz horn? Also, the distortion below cutoff isn't any worse. Am I missing something?
You can only try
I'll see what I come up with. I'm doing some work with a different type of tapped horn. I've listened to the baby one for over a month and it does distort below cut off. But I'll do some actual carefull measurements on the bigger brothers. It'll be interesting.
Mark
I'll see what I come up with. I'm doing some work with a different type of tapped horn. I've listened to the baby one for over a month and it does distort below cut off. But I'll do some actual carefull measurements on the bigger brothers. It'll be interesting.
Mark
Wow! As I can see the FR extends well down to 500Hz! And they call that a 1.2kHz horn? Also, the distortion below cutoff isn't any worse. Am I missing something?
Agreed, looks odd to me as well.
Thanks guys. The JBL measurement looks great. Interesting to see that distortion does not rise under the cut off. We don't know what phase is doing, tho..
Wow! As I can see the FR extends well down to 500Hz! And they call that a 1.2kHz horn?
Yes and there is some confusion in thier own literature as well early on it was 800Hz short throw and 1200Hz long throw. It changes part numbers in the Pro catalog and is the H91 in the Consumer catalogs. In the Consumer sheets it's 500Hz until about the late 70's where it becomes and stays a 1200Hz horn both there and in the Pro literature until the 80's when it was retired. Clear as mud.
Rob🙂
Hello,
We have to take care to how such mesurements are presented.
What we see is that the "absolute" THD curve comes nearer to the response curve (passing from 40dB = 1% at 1kHz to #-20dB = #0.1% at 200Hz) when the frequency decreases below the cut-off.
This indicates a 10 times rise in the distortion relatively to the "fundamental". (For further decreasing frequency there will be a frequency for which the THD curve will cross the response curve, at that pont THD will be 50%...).
Another important curve to consider is IMHO the group delay curve of the horn.
Best regards from Paris, France
Jean-Michel Le Cléac'h
Interesting to see that distortion does not rise under the cut off.
Last edited:
Augerpro has done testing on many horns/waveguides this last summer.
http://www.htguide.com/forum/showthread.php4?t=33682
QSC Waveguides are cheap and impressive.
http://www.htguide.com/forum/showthread.php4?t=33682
QSC Waveguides are cheap and impressive.
This indicates a 10 times rise in the distortion relatively to the "fundamental".
Yes, that's very true. I forgot to mention it. The THD graph does go down, but not as fast as the amplitude. You are correct that it's the ratio that's important.
However, on this horn at least the distortion does fall away from the level in the pass band. It may still be noticeable, tho...
Phase and group delay would be very useful info. I suspect that is where the major trouble lies.
Hello,
Everybody has probably notice the mistake:
-20dB THD is 10% distortion.
(but the 10 times larger relative THD at 200Hz versus 1kHz is OK).
Best regards from Paris, France
Jean-Michel Le Cléac'h
Everybody has probably notice the mistake:
-20dB THD is 10% distortion.
(but the 10 times larger relative THD at 200Hz versus 1kHz is OK).
Best regards from Paris, France
Jean-Michel Le Cléac'h
Hello,
#-20dB = #0.1% at 200Hz) when the frequency decreases below the cut-off.
This indicates a 10 times rise in the distortion relatively to the "fundamental". (For further decreasing frequency there will be a frequency for which the THD curve will cross the response curve, at that pont THD will be 50%...).
Another important curve to consider is IMHO the group delay curve of the horn.
Best regards from Paris, France
Jean-Michel Le Cléac'h
Last edited:
Jmmlc said:Another important curve to consider is IMHO the group delay curve of the horn.
panomaniac said:Phase and group delay would be very useful info. I suspect that is where the major trouble lies.
Here's the Group Delay ( GD ) for one ( of my 2 ) Altec 288-8K(s) mounted to an Emilar EH500-2 Radial Horn ( on a Selenium 1.4" to 2" adapter ) .

- Clearly the group delay peaks at just over 500 hz .
- I find the "GD curve" quite interesting in respect to the fact that in the product literature, Emilar labelled this radial as a 500 hz horn ( these days, most would not agree ).
- I use this horn ( which is slightly smaller than an Altec 811 ) down to around 800 hz. This happens to be in the middle of the "rising" GD curve .
- Clearly, the frequencies from 2000 hz and above, are clear of the rising GD curve .
- FWIW, at the low levels I listen to , I hear no "horn honk" .
- Under increased "dynamic" drive levels, I would "expect" that the frequency dependant ratio of delayed sound ( 6 ms at 500 hz ) to the "baseline " ( 1.5 ms ) would grow. I believe it would ( expand & collapse ) in sync to much higher dynamic voltage inputs .
- This "breathing" sort of aberration ought to be audible and identifiable as Horn-Honk / ( though to prove that contention, another "Gedlee-type" controlled university study needs to be done ) .
- Right now, that ratio is about 4 ( 6 ms / 1.5 ms ) , when measured at 500 hz (with 1/24th octave resolution) to above 2000 hz .
cheers >< 🙂
Last edited:
Hello,
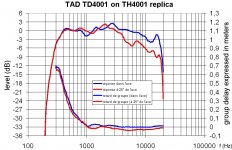
Here attached the response and group delay curves I measured on a TAD TD4001 compression driver mounted on a TH4001 horn replica. (blue = on axis, red = 25° from axis)
As I use to do for my group delay curves it is expressed in equivalent distance travelled at the speed of sound (meters). I use for myself horns at frequencies for which their equivalent group delay is less than 0.1 meter.
Best regards from Paris, France
Attachments
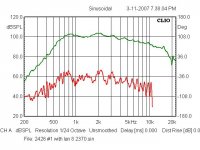
Here is what phase might look like for the JBL 2370 if it is minimum phase.
An externally hosted image should be here but it was not working when we last tested it.
Hi Earl,Here's the Group Delay ( GD ) for one ( of my 2 ) Altec 288-8K(s) mounted to an Emilar EH500-2 Radial Horn ( on a Selenium 1.4" to 2" adapter ) .
Since you have the impulse response in ARTA, maybe you could answer a question that came up on another thread. Is the rolloff below the horn cutoff frequency (mostly) minimum phase? Earl Geddes says it isn't but I don't see why it wouldn't be. It should be easy to check in ARTA by plotting excess phase and adjusting the delay time to flatten the excess phase as much as possible. Thanks in advance if you have time to take a look.
Edit: I don't know if you have noticed but the latest version of ARTA lets you adjust the delay time from the frequency response window so you don't have to keep going back to the impulse response.
Last edited:
Hi Earl,
Earl Geddes says it isn't but I don't see why it wouldn't be. It should be easy to check in ARTA by plotting excess phase and adjusting the delay time to flatten the excess phase as much as possible.
I said that I didn't see any reason to assume it's minimum phase and from the theory I would not expect it to be. That's not to say that it isn't nearly minimum phase - I really don't know. It's irrelavent to me so I have never actually checked.
panomaniac said:Looking for measurements that any of you may have of horns and waveguides near their low cut-off frequency.
Standard practice is to high pass the horn at least an octave above its cut-off frequency. Is this really needed at home hi-fi levels? Some say no.
Here's a fairly HiRez look at my 288 on the Emilar radial horn with a ( highish Q, 2-pole ) HiPass filter in place ( there's also a simplistic HF contour circuit at work bumping up the HF -UHF region ) .
- Approx. 700 hz looks to be the 3 db down point of this horn/driver combo .

- Here's the system response in the crossover region ( ungated ) .
- The rest of the system is an MTM setup comprising ; a JBL 10" ( le10H ) over a JBL 14" ( le14H ) / with the horn stuck in the middle .
- Center to Center spacing ( for the two woofers ) is about 21" .

- The cursor shown above ( at 378 hz ), highlights a response anomoly that also shows up on the group delay trace ( below ) .
- The following pic is the full system focussing on the crossover area .
- The red trace is 1/24th octave while the green trace running through it is 1/3 octave .

- What I find interesting ( looking above at the GD trace for the full system ) is how the addition of the 2 woofers' Group Delay seems to average down the horns' anomolous GD response from 500 hz to 1000 hz .
- GD which peaked at 6 ms ( in the 500 hz region ) now peaks at only 3.5 ms . A small GD bump at 800 hz has smoothed out .
- The 500 hz region no longer represents the apex of ( what looks to me to be ) an exponential climb in GD behavior .
- That apex has been shoved lower / into the operating domain of the two woofers .
- Here's the original GD again ( for only the horn ) for ease of comparison .
panomaniac said:So if you have phase, distortion and impulse measurements that you would like to share, please do. Let us know what the horn and driver are, if you can. Also point out what you think are the important parts of your measurements. Actual measurements are vastly preferred over simulations here. Simulations are OK if you can also show us the real measurements.
It will be interesting to see what horns are really doing down there. Thanks!
catapult said:Since you have the impulse response in ARTA, maybe you could answer a question that came up on another thread. Is the rolloff below the horn cutoff frequency (mostly) minimum phase?
Sorry , I don't have the phase response of this setup . I did these studies back in early June and don't have the original file to extract any more info from .
>< cheers 🙂
Dennis,
Here's the phase response of the Altec driver on the Emilar radial horn ( hopefully this is the info that you're after ) .

Panomaniac,
- The curve shows that predictable phase response goes out the window at frequencies below @ 250 to 275 hz ( for this horn/driver combo ).
- I cross out this combo about 1 1/2 octaves above that point ( or stated another way, the phase anomolies are at least 18 db down from the primary signal )
>< cheers 🙂
Here's the phase response of the Altec driver on the Emilar radial horn ( hopefully this is the info that you're after ) .
Panomaniac,
- The curve shows that predictable phase response goes out the window at frequencies below @ 250 to 275 hz ( for this horn/driver combo ).
- I cross out this combo about 1 1/2 octaves above that point ( or stated another way, the phase anomolies are at least 18 db down from the primary signal )
>< cheers 🙂
Last edited:
Well, we still don't know if the roll-off is minimum phase. However, the rise in the group delay is entirely consistent with minimum-phase behavior and doesn't imply that there's anything unusual about the way horns behave compared to any other driver. The lower and steeper the cutoff (combined electrical and acoustical response) the larger the peak in the group delay.
Here are a couple of group-delay pics showing just an electrical filter, no horn contribution at all. A 4th order Butterworth highpass at 300 Hz gives a group delay curve similar to the one Jmmlc posted. Raising the cutoff to 500 and increasing the slope to 6th order gives a curve similar to the one EarlK posted.
Here are a couple of group-delay pics showing just an electrical filter, no horn contribution at all. A 4th order Butterworth highpass at 300 Hz gives a group delay curve similar to the one Jmmlc posted. Raising the cutoff to 500 and increasing the slope to 6th order gives a curve similar to the one EarlK posted.
Attachments
Last edited:
- Status
- Not open for further replies.
- Home
- Loudspeakers
- Multi-Way
- Horn cut-off distortions and phase