You can attach the graphs, that would be much more revealing than the data tables ...
Jan
Although Steps draws graphs, it doesn't export them. It only exports in CSV or text.
I'll see if I can make a graph using Excel and send it here.
screen shot. use the prtsc key beside F12. Hit alt-prtsc if you just want a shot of the window and not the entire screen.
Last edited:
screen shot. use the prtsc key beside F12. Hit alt-prtsc if you just want a shot of the window and not the entire screen.
Oh it's far too late. I took the measurements yesterday.
I have made the crude graphs.
I can retake the measurements if you need a clearer graph, but it will take like 10 mins each.
I have attached them down below.
View attachment magn-dist(no feedback).pdf
View attachment magn-dist(with a 500R negative feedback resistor).pdf
View attachment magn-dist(with a 2K negative feedback resistor).pdf
Always save measurements in a form that it clear at least to you, and under which conditions it was done.. A week from now you don't remember what the f... you did a week ago;-)
Then you need to do it again to check. And again ...
Jan
Then you need to do it again to check. And again ...
Jan
I know right? xDAlways save measurements in a form that it clear at least to you, and under which conditions it was done.. A week from now you don't remember what the f... you did a week ago;-)
Then you need to do it again to check. And again ...
Jan
I will try to redo the test, 3 times, and I'll send the screenshots.
I know right? xD
I will try to redo the test, 3 times, and I'll send the screenshots.
Oh I forgot to say that there was an 8.2Ohm resistor across the output transformer.
OK umm... I'm running the tests now and without any negative feedback, it's looking pretty clean :|
I really don't know what's going on.
Although, I suspect that it was because of my sound card. It has a bit of distortion after a certain volume and I think it was at 12% last time and now it's at 8% (which I discovered yesterday after those tests that it has almost 0% distortion at 8% volume).
I really don't know what's going on.
Although, I suspect that it was because of my sound card. It has a bit of distortion after a certain volume and I think it was at 12% last time and now it's at 8% (which I discovered yesterday after those tests that it has almost 0% distortion at 8% volume).
AbaddonD, what circuit are you using? We went thru a number of iterations. Anyway … I wish you well. -= GoatGuy ✓ =-
AbaddonD, what circuit are you using? We went thru a number of iterations. Anyway … I wish you well. -= GoatGuy ✓ =-
The latest one with only one 6AQ5 in circuit.
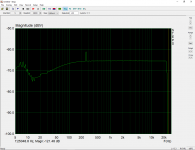
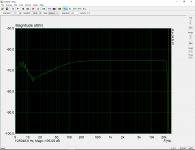
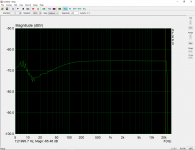
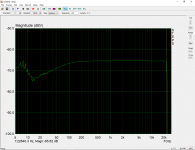
I have attached 4 pictures below.
It seems a lot cleaner. I think the previous tests had a lot of distortion from the input. Now that it has clean signal coming in, it also has clean signal coming out. I forgot to take pictures of the distortion graph, but on the last one (500R) the THD seems oddly high at about 55% average but I think it's wrong or something. The D2 seems more reasonable though at a max of 3.03% at 30.0Hz and it's least D2 at 51.3Hz at 0.06%.
Also, I think that spike on the first graph is an error or something.


Have you plugged in a speaker? How does it sound?
Yes, I have. Both with my high efficiency speakers and a pair of mid-range and super high-end headphones and it sounds very good on all of them. Just at high input audio voltages, it starts clipping at low frequencies. It's a bit annoying.
Last edited:
- Home
- Amplifiers
- Tubes / Valves
- Help with 12AQ5 class A low gain and distortion