I thought so too, there's nothing like a little mystery to grab my attention 🙂Well, all very interesting!
The creep you describe does seem consistent with what I'm seeing - at least with the Visaton driver. When the suspension is exercised over a significant excursion the spider material is being stretched on both excursion peaks, so that the overall stiffness temporarily reduces. Is that right ? It's taking about 10 seconds after the "large" excursion is removed for the results to return to the small signal values.Most spiders exhibit a lot of creep phenomenon. That is if you stretch them to a certain displacement the force required to hold that shift relaxes after some seconds. Release them and the pop back not quite to zero and then creep slowly back to the center spot. They are taking a set to static inputs.
What's interesting is that the "large" signal response is identical for a 1mm peak to peak excursion AC signal, and a 20mm peak to peak manual back and forth movement, so while a positional bias may be left after manually moving the cone back and forth, there is no such positional bias when the cone is moving under its own power at ~30Hz.
No that's not what I was trying to say, I think you hit the nail on the head with spider creep - move the cone back and forth a significant amount and the spider material is semi-permanently stretched and becomes more compliant for a few seconds.You are saying somewhat the opposite, that this exercising is breaking them free from some central point stiffness and that they later take a set back into the stiffer set point. I don't think I have ever seen this short of some older ferrofluid tweeters that needed a little exercise to limber them up between uses (I'm starting to know how that feels).
Well the Visaton driver is nothing exotic:Are the spider and surrounds of any exotic material? Are the spiders especially heavy duty with lots of resin impregnation?
Visaton - Lautsprecher und Zubehör, Loudspeakers and Accessories
Standard enough looking spider of quite large diameter, and a rubber roll surround.
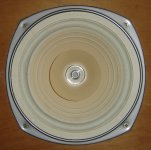
The Coral driver is a bit more exotic, the surround is a woven fabric of some sort (linen?) with an inward facing roll, however the surround is very compliant compared to the spider, so I'd be surprised if the surround contributed anything other than sideways centering, and maybe 10% of the total stiffness at most. The spider is fairly normal looking, but quite compliant.
(Picture attached)
I'm pretty sure that my measurement set up is giving me valid results, the question is how to interpret them and which results I should be taking note of 🙂 There may be some unusual characteristic of the driver that could do with more investigation, although it's practical consequence may be nil - at bass frequencies there will usually be enough excursion to move into the "more compliant" mode, and at midrange frequencies where excursions are minuscule the driver is mass controlled anyway.In the end I don't think you are having trouble with your testing methodology as much as you have stumbled across an unusual driver. Our usual assumption is that non-linearities diminish with level, below some threshold they are inconsequential. That is what the notion of "small signal" comes from. Your driver doesn't seem to respond that way.
I don't think so, but I guess there is a small possibility. It is a very old driver, (older than me 🙂 ) but I would have thought even a slight amount of rubbing (of the voice coil I assume you mean) would cause audible distortion.It isn't rubbing is it? That gives rise to stick friction and crossover-notch-like dead zones at small drive.
I expected Qms to increase if the compliance became stiffer, but I wasn't expecting a change of that magnitude. 😀Don't wory about Qms. It will tend to track with fs (fs/Qt should be constant) so if fs is not as expected Qms will also be off.
David S.
Attachments
Last edited:
Not exactly. Spyder creep that I am familiar with is a relaxation of the position shift but it is still as stiff as it was for any additional incremental shift. It is more of a time dependent resistance to DC shifts (AC part stays unchanged). Have you ever played with Silly Putty? Non-Newtonian fluid - Wikipedia, the free encyclopedia I wouldn't expect to see resonance vary with offset of a typical spider with creep.The creep you describe does seem consistent with what I'm seeing - at least with the Visaton driver. When the suspension is exercised over a significant excursion the spider material is being stretched on both excursion peaks, so that the overall stiffness temporarily reduces. Is that right ? It's taking about 10 seconds after the "large" excursion is removed for the results to return to the small signal values.
What's interesting is that the "large" signal response is identical for a 1mm peak to peak excursion AC signal, and a 20mm peak to peak manual back and forth movement, so while a positional bias may be left after manually moving the cone back and forth, there is no such positional bias when the cone is moving under its own power at ~30Hz.
There must be an audible distortion with this? If you feed voltage at resonance and run the level over and under the "threshold" does it sound like it "wakes up" at some level? Is it slightly distorted above or below the threshold?
Are you sure there isn't a dead zone electrical distortion in the driving signal used for testing?
David S.
No I haven't played with Silly Putty before. In the link you posted, looking through the table of "Types of non-Newtonian behaviour", I think Thixotropic most agrees with what I'm measuring.Not exactly. Spyder creep that I am familiar with is a relaxation of the position shift but it is still as stiff as it was for any additional incremental shift. It is more of a time dependent resistance to DC shifts (AC part stays unchanged). Have you ever played with Silly Putty? Non-Newtonian fluid - Wikipedia, the free encyclopedia I wouldn't expect to see resonance vary with offset of a typical spider with creep.
From the article, shear thinning is time-independant decrease of viscosity with stress, but that would seem to suggest it would introduce a non-linear distortion due to action within an individual cycle of movement. (In fact this effect is probably present in all speaker suspensions as well as they near their limits ?)
Thixotropic is a time dependant decrease in viscosity with increased stress - and presumably has a time dependant "recovery" time as well. In other words it may take a significant fraction of a second of applied stress (more than a few cycles at 30Hz) for the compliance to increase, and a significant amount of time for it to return to its rest value after stress is removed.
I'm just trying to think of a test I can come up with to see how quickly it changes in each direction.
Which driver are you talking about here ? Although both drivers show change in Fs with excursion, between "micro" excursions and visible excursion, I'm not entirely sure that they're by the same mechanism, (when one has a relatively stiff rubber surround and one has a very compliant woven fabric surround) without doing some more detailed measurement.There must be an audible distortion with this? If you feed voltage at resonance and run the level over and under the "threshold" does it sound like it "wakes up" at some level? Is it slightly distorted above or below the threshold?
What about if I feed the drivers a tone at resonance both above and below the threshold level required for a change in Fs, and do a nearfield measurement looking for distortion products to see if there is an anomalous change near the threshold ? I'm not sure if I can get enough dynamic range at the low drive level for a meaningful result, but I'll try it anyway.
If it is a thixotropic effect then my interpretation of what that means is that although the resonance would shift near the threshold drive level there wouldn't be any change in distortion, except for a general smooth increase in distortion with increasing level as expected.
On the other hand if it's something else like physical rubbing there should be a discontinuous change in distortion ?
You mean like crossover distortion ? I'll check, but I don't think so. The distortion from the sound card measures around 0.005% so it doesn't seem likely.Are you sure there isn't a dead zone electrical distortion in the driving signal used for testing?
David S.
Last edited:
I have reported how variable I find Vas measurement due to temperature variations. Not just ambient temperature but temperature inside the surround and spider.
These two components are mechanical dampers. They absorb motion energy and dissipate that as heat energy. This internal heating changes the mechanical Q and changes the mechanical compliance.
This throws any measurement results you take at varying times and varying powers and varying Ta, all over the place.
If you want comparable results you must use comparable conditions.
If the two comparables are the "power input effect" then you must find a methodology that takes all other variables out of the comparison. Internal heating will give a different result. Interpreting what the results tell you is not simple. Add in all the other variations and you have no hope of understanding how to correlate results to "power input effect".
I have reported how variable I find Vas measurement due to temperature variations. Not just ambient temperature but temperature inside the surround and spider.
These two components are mechanical dampers. They absorb motion energy and dissipate that as heat energy. This internal heating changes the mechanical Q and changes the mechanical compliance.
This throws any measurement results you take at varying times and varying powers and varying Ta, all over the place.
If you want comparable results you must use comparable conditions.
If the two comparables are the "power input effect" then you must find a methodology that takes all other variables out of the comparison. Internal heating will give a different result. Interpreting what the results tell you is not simple. Add in all the other variations and you have no hope of understanding how to correlate results to "power input effect".
You make some excellent points about changes with temperature, and local heating that may occur in the suspension with movement altering the compliance.
I think the best way to differentiate the many possible and confounding factors would be for me to plot a graph of Fs versus signal level/excursion and see what shape it forms.
My guess is with increasing excursion along the horizontal axis and increasing Fs on the vertical axis, we'll see a result very much like a high shelving filter - flat at the left representing the "micro signal" measurement, a downwards transition slope as Fs reduces, then levelling out again at the "large signal" reading, and perhaps changing again slightly near Xmax.
The reason I suspect it will flatten out is because the measured parameters with ~1mm p-p excursion were identical to the measured parameters taken at "micro" excursions immediately after a few seconds of 20mm p-p movement. If it was purely temperature change related I would have thought the more the excursion the more the change, and yet despite the presumably different amount of localized heating between 1mm p-p and 20mm p-p the result was nearly identical. On the other hand it makes sense if it's some kind of threshold effect.
I'll take some measurements anyway and report back.
Last edited:
I am following all this with great curiosity. Wondering through my fingers here, is there any (emphasis) dc component in your signal? Less likely, a very low modulation? Wouldn't need to be much. Possible to supply a variable dc offset to the test?
Wife and I are off on holiday, can't get to the lab.
Wife and I are off on holiday, can't get to the lab.
Unfortunately I've recently moved (country) and as far as Electronics equipment and tools go, I'm living out of a shoe box for the time being! 😀 I don't have a DC coupled power amp, nor a variable DC supply, or even a big rheostat to apply some variable DC, however based on my findings today I don't think I need to test that. (See next message 🙂 )I am following all this with great curiosity. Wondering through my fingers here, is there any (emphasis) dc component in your signal? Less likely, a very low modulation? Wouldn't need to be much. Possible to supply a variable dc offset to the test?
Wife and I are off on holiday, can't get to the lab.
Well I've spent an interesting couple of hours measuring apparent Fs vs drive level for both drivers, and I've created a couple of Excel graphs. (See attachments below)
I tested both drivers from about half Xmax (0dB on the graph) all the way down to -54dB, where measurement noise started to impact the results - in fact there may be a small error in the -54dB and -48dB readings that is obscuring what is probably a plateau.
What is apparent is that there is a steady downward trend in Fs with increasing drive on both drivers, and contrary to what I had thought, it doesn't flatten out above a certain signal level. 😱 Although the fall in Fs does slow down a lot in both drivers (especially the small one) as you start approaching Xmax, it could hardly be considered to have plateaued.
On the Visaton driver there is a clear plateau below -30dB that could be considered to be "small signal" conditions. (The bump at -48dB is within measurement error) Therefore it's pretty clear at what level to measure this driver. (Although still keeping in mind it will change when driven with bass)
The situation with the Coral driver is far less clear, there is a huge change in Fs across the range from nearly 48 down to 34.5 with a steady and steep drop with no clear plateau at the small signal end. It's not at all clear to me at what level the measurement should be taken, because you're on a slope pretty much no matter where you measure, and the small signal reading is so dramatically different to the large signal reading I'm not sure that using the small signal results would provide a valid prediction of bass response.
The Qms also changes dramatically. The change in both Fs and Q is so dramatic I've attached an impedance plot - the yellow line is the 0dB response while the green was taken at -42dB. The impedance peaks at a staggering 145 ohms in the low drive scenario 😱 (For a nominal 8 ohm driver)
I think all I can really conclude from this exercise is that choosing the measurement level does matter if one wants to get repeatable consistent results, with the correct level being different for different drivers. (And it's possibly one of the big sources of error when comparing T/S specs taken under different test conditions)
I'm still dubious of whether measurements taken at such small signal levels will be representative of actual bass performance at normal listening levels though, particularly with a driver that has such a huge variation.
Attachments
![[Fs vs signal level.xls]Sheet1 Chart 2 9022011 45450 p.m..jpg](/community/data/attachments/195/195574-22c9b801a9b935bc5fe3185a688abace.jpg?hash=Ism4Aam5Nb)
![[Fs vs signal level.xls]Sheet1 Chart 3 9022011 45533 p.m..jpg](/community/data/attachments/195/195583-667bcfb5205408ce14260adc06b6e6ac.jpg?hash=ZnvPtSBUCM)

Last edited:
Do you have a copy of the LDC by Vance Dickason? I have the 7th edition.
Also Robert M. Bullock III, had several good dissertations on T/S and achieving accurate Vas measurements, I have one of his books, "Bullock On Boxes."
He makes extremely knowledgeable recommendations.
Also Robert M. Bullock III, had several good dissertations on T/S and achieving accurate Vas measurements, I have one of his books, "Bullock On Boxes."
He makes extremely knowledgeable recommendations.
These are pretty unusual results. In the case of the Coral you have a 45% drop in stiffness as level goes up. (I assume mass is constant, you aren't approaching the speed of light are you?) It really seems like a sort of stick-friction where a certain movement is needed to break free. I'm not saying anything is rubbing as you would hear that.
Generally suspension nonlinearities show up at high excursion, not low. Your impedance curves look pretty classic. High creep is usually seen via a little bit of "lean" in the tip of the impedance curve. Not seeing it here.
David S.
Generally suspension nonlinearities show up at high excursion, not low. Your impedance curves look pretty classic. High creep is usually seen via a little bit of "lean" in the tip of the impedance curve. Not seeing it here.
David S.
No, I don't have either of those. I'll keep a look out for them, Thanks.Do you have a copy of the LDC by Vance Dickason? I have the 7th edition.
Also Robert M. Bullock III, had several good dissertations on T/S and achieving accurate Vas measurements, I have one of his books, "Bullock On Boxes."
He makes extremely knowledgeable recommendations.
Here's a thought. I understand that fabric woven surrounds in some full range drivers (especially older ones) have some kind of "lubricant" impregnated in the fabric of the surround to keep the surrounds supple with age. (Something roughly of the consistency of a grease, but not a normal mineral based grease)These are pretty unusual results. In the case of the Coral you have a 45% drop in stiffness as level goes up. (I assume mass is constant, you aren't approaching the speed of light are you?) It really seems like a sort of stick-friction where a certain movement is needed to break free. I'm not saying anything is rubbing as you would hear that.
On drivers where this has dried out the suspension can be much stiffer than it was when new. Not the case with this pair, which were sealed unused until 2003, but I have a pair of a similar model that were in use since the early 70's with the same cone design and Mms where the surround is so stiff that the free air resonance is 105Hz! (Needless to say, they can't produce any worthwhile bass)
Could such a lubricant cause a stiffness that starts off higher and reduces so dramatically with increased movement ? Non-newtonian fluid behaviour of the lubricant perhaps ?
From long and sometimes painful experience, let me make a few observations:
1) Thiele-Small paramaters are APPROXIMATE. Speakers don't really work exactly like that. It's kinda like Newtonian physics versus Einsteinian or something: one theory is a pretty good approximation, but it's not 100% accurate.
What Thiele and before him Benson did was notice that in some ways a loudspeaker resembles and electrical highpass filter, and worked to shape the physical parameters of the speaker into classic filter formulas. Dick Small extended this to try and make it all more usable to speaker designers.
But speakers are NOT electrical highpass filters made from resistors and capacitors and inductors --> you are beating yourself over the head if you try and get numbers that are super accurate. The numbers change with the drive signal, the drive voltage, the temperature of the driver (which affects not just the moving parts but the raw resistance of the coil a bit as well), humidity, the sign of the Zodiac the sun is currently passing through, magnetic wandering of the North Pole, and the price of peas in Persia :-D The folks who make LEAP would say that Thiele-Small is a useless obsolete model; they are kinda correct although perhaps a bit overstated. The approximation still lets you make design decisions of some value.
As for the actual measurement:
- Don't hang the speaker! Even huge pro subs have a resonance as a hanging mass on a chain.
- Face up/down against gravity? Nah. Have that test box facing horizontally. Free air? Vertically clamped to a SOLID baffle, please. For very heavy subs, sometimes just resting the magnet on the corner of a table can work fine as well...
- But don't have surfaces close by other than that. And DO NOT BLOCK MAGNET VENTS!!
- Yes, putting the speaker on a big baffle creates a bit more air load which lowers the resonance. If the baffle is barely bigger than the cone, though, don't worry about it.
- Measurements always vary a tiny bit, even if you make them repeatedly. Don't stress about it.
- Constant voltage through a 0.1 or 0.05 ohm resistor would be preferable. Then again, I think it is more important to get an entire impedance curve, so if a noise method is what you have available, do that. Looking at the whole impedance curve lets you see if there are any problems, like sharps spikes and dips from hanging the speaker, or an impedance bump down at like 1 Hz if your seal to the test box is not good.
Last edited:
Here's a thought. I understand that fabric woven surrounds in some full range drivers (especially older ones) have some kind of "lubricant" impregnated in the fabric of the surround to keep the surrounds supple with age. (Something roughly of the consistency of a grease, but not a normal mineral based grease)
On drivers where this has dried out the suspension can be much stiffer than it was when new. Not the case with this pair, which were sealed unused until 2003, but I have a pair of a similar model that were in use since the early 70's with the same cone design and Mms where the surround is so stiff that the free air resonance is 105Hz! (Needless to say, they can't produce any worthwhile bass)
Could such a lubricant cause a stiffness that starts off higher and reduces so dramatically with increased movement ? Non-newtonian fluid behaviour of the lubricant perhaps ?
If you had one unit with a variable fs then I would guess it was an odball surround or spider material, but two different brand/make of driver have a similar effect. This makes me wonder if the measuring system isn't an issue? You might try the resonance vs. level of a couple of very different drivers to see if they all have similar resonance shift.
Frankly I have never measured resonance vs. drive level. I know it is an issue at high levels so I stay away from high level measurements. Always assumed measurements below a certain threshold would be similar.
If you want to get on with your life then use parameters from your medium strength measurements. The rest is more of academic interest.
One interesting test is a lissajous pattern of voltage vs. current.
Lissajous curve - Wikipedia, the free encyclopedia
This would be on an oscilloscope in XY mode with voltage for one axis and current (voltage across a drive resistor) for the other axis. It should give a diagonal line or slim ellipse near resonance. Probably something different in your case.
David S.
Your mention of Lissajous reminds me that some few drivers are simply not linear even at "small signal" levels. But I too suspect the measurement setup. It's not clear to me if a complete curve is being measured, or just "Resonance"; ya gotta look a whole curve, to be sure things smoothly come up to a peak without weird dips or a very asymmetric shape. Drivers can possibly be damaged is another possibility.
No, I don't have either of those. I'll keep a look out for them, Thanks.
BKAA68 - Loudspeaker Design Cookbook
BKAA8 - Bullock on Boxes
http://www.parts-express.com/pe/showdetl.cfm?Partnumber=500-035
Bullock On Boxes Book | Parts-Express.com
Something went wrong with your quoting of Dave, but I've managed to pluck your comments out 🙂
Ok, I better describe the measurement set up in more detail to allay any concerns that there is a problem with the measurement methodology.
LIMP has two measurement modes - correlated noise, or stepped sine wave.
The noise mode drives the speaker with continuous pseudo random pink noise and is able to measure a complete impedance curve over the entire frequency range in about 1 second, depending on the FFT size and resolution selected. (Maximum resolution is about 1/24th octave)
It can run in real-time mode as well, showing changes as they occur, which is how I originally discovered with the Visaton driver that testing at a very low signal level showed different impedance curves (lower resonance frequency) immediately after physically moving the driver back and forth through it's excursion and then letting it rest - which then gradually creeps back to the small signal impedance curve over 10-15 seconds. You can literally see the impedance curve morph (resonance increasing) before your eyes. 🙂
The limitation of the noise mode (according to the author) is that for small signal level testing it is less able to reject microphone noise from the speaker itself picked up from the room, which can add a noise like ripple to the entire curve. Also in the context of this discussion - testing at different levels, you can't easily get much cone excursion since the power is spread across a pink noise spectrum, and what excursion you can get is semi-random.
It's not clear to me that a random excitation is a suitable test signal when examining resonant frequency vs excursion level, so for that I used the stepped tone mode.
Stepped tone mode does exactly that, it's not a sweep, but a series of dozens of stepped sine waves of equal amplitude, at 1/24th or 1/48th octave intervals, each lasting about 1 second. Each frequency is measured discretely and plotted on the graph.
For previous measurements I had used my Audigy 2 ZS (with an output impedance of ~35 ohms, and maximum output of about 2.2v RMS) to drive the speaker directly via a 33 ohm resistor. The left and right line inputs directly sample the speaker and drive side of the 33 ohm resistor respectively.
I can get about 1mm excursion with the drive directly from the sound card but for this test I decided I needed more excursion so I introduced a power amp into the equation. The drive is coming from the power amp, via a 33 ohm 10 watt resistor and left and right line inputs tap on either side of the resistor as before, except this time they're connected via 20dB L-Pad's (as recommended in the ARTA docs) to scale the signal safely down for the line input.
Part of the calibration procedure for LIMP is to measure any channel imbalance between left and right inputs, thus any small errors in the two L-Pad's are accounted for. The dual channel measurement mode also removes any frequency response variations introduced by the amplifier or sound card output, and allows accurate measurement of the impedance even with a low value series resistor. (approaching a constant current source is not a requirement for this measurement method, as it doesn't just naively measure voltage across the speaker)
As for measuring a whole curve vs just resonance, normally in stepped sine mode I measure the entire frequency range from 10Hz to 45Khz, and previous measurements taken for calculating T/S parameters (done automatically in LIMP) were done this way.
The problem with doing that for this set of tests is I had 12 to 15 different signal levels to test for each driver, and each test takes about 3 minutes to complete in 1/48th octave steps. That would be over an hour and a half of continuous stepping tones. If I wasn't crazy before that, I would be afterwards 😱😀
As well as that, an approximate 1watt sine wave on a sensitive full range driver is a very loud noise by the time you get to the midrange and treble, so much so that I'd have to leave the room during each test, and I don't think my neighbours would be too chuffed either. 😛
Since the reason for this set of tests was only to determine changes in resonance, I restricted the measurement range to 20-40 Hz for the Visaton, and 30-60Hz for the Coral, wide enough to show well down the skirts of the peak and clearly see where the peak is. (Which I believe LIMP finds precisely by interpolating the zero crossing of phase, if it falls between two test frequencies)
Because I wasn't going above 60Hz on unmounted drivers I was able to drive them quite hard without making a lot of noise.
I then entered the data into Excel by hand and plotted it.
For the impedance curve I attached in my post (you might have missed that one ?) I increased the measurement range to 20-100Hz, but otherwise settings were identical, so you can see the quality of curves that were being measured by that.
As far as trying to eliminate measurement procedure goes, I think the stepped sine method is pretty fool proof, but to be sure I did a test with a good old analogue sine wave generator, a 680 ohm resistor driven from a power amp, and a multimeter to measure the voltage across the speaker, and looked for the impedance peak at different signal levels and confirmed a downwards trend with increasing drive level.
Hope that answers any questions you might have about measurement procedures.
head_unit said:Your mention of Lissajous reminds me that some few drivers are simply not linear even at "small signal" levels. But I too suspect the measurement setup. It's not clear to me if a complete curve is being measured, or just "Resonance"; ya gotta look a whole curve, to be sure things smoothly come up to a peak without weird dips or a very asymmetric shape. Drivers can possibly be damaged is another possibility.
Ok, I better describe the measurement set up in more detail to allay any concerns that there is a problem with the measurement methodology.
LIMP has two measurement modes - correlated noise, or stepped sine wave.
The noise mode drives the speaker with continuous pseudo random pink noise and is able to measure a complete impedance curve over the entire frequency range in about 1 second, depending on the FFT size and resolution selected. (Maximum resolution is about 1/24th octave)
It can run in real-time mode as well, showing changes as they occur, which is how I originally discovered with the Visaton driver that testing at a very low signal level showed different impedance curves (lower resonance frequency) immediately after physically moving the driver back and forth through it's excursion and then letting it rest - which then gradually creeps back to the small signal impedance curve over 10-15 seconds. You can literally see the impedance curve morph (resonance increasing) before your eyes. 🙂
The limitation of the noise mode (according to the author) is that for small signal level testing it is less able to reject microphone noise from the speaker itself picked up from the room, which can add a noise like ripple to the entire curve. Also in the context of this discussion - testing at different levels, you can't easily get much cone excursion since the power is spread across a pink noise spectrum, and what excursion you can get is semi-random.
It's not clear to me that a random excitation is a suitable test signal when examining resonant frequency vs excursion level, so for that I used the stepped tone mode.
Stepped tone mode does exactly that, it's not a sweep, but a series of dozens of stepped sine waves of equal amplitude, at 1/24th or 1/48th octave intervals, each lasting about 1 second. Each frequency is measured discretely and plotted on the graph.
For previous measurements I had used my Audigy 2 ZS (with an output impedance of ~35 ohms, and maximum output of about 2.2v RMS) to drive the speaker directly via a 33 ohm resistor. The left and right line inputs directly sample the speaker and drive side of the 33 ohm resistor respectively.
I can get about 1mm excursion with the drive directly from the sound card but for this test I decided I needed more excursion so I introduced a power amp into the equation. The drive is coming from the power amp, via a 33 ohm 10 watt resistor and left and right line inputs tap on either side of the resistor as before, except this time they're connected via 20dB L-Pad's (as recommended in the ARTA docs) to scale the signal safely down for the line input.
Part of the calibration procedure for LIMP is to measure any channel imbalance between left and right inputs, thus any small errors in the two L-Pad's are accounted for. The dual channel measurement mode also removes any frequency response variations introduced by the amplifier or sound card output, and allows accurate measurement of the impedance even with a low value series resistor. (approaching a constant current source is not a requirement for this measurement method, as it doesn't just naively measure voltage across the speaker)
As for measuring a whole curve vs just resonance, normally in stepped sine mode I measure the entire frequency range from 10Hz to 45Khz, and previous measurements taken for calculating T/S parameters (done automatically in LIMP) were done this way.
The problem with doing that for this set of tests is I had 12 to 15 different signal levels to test for each driver, and each test takes about 3 minutes to complete in 1/48th octave steps. That would be over an hour and a half of continuous stepping tones. If I wasn't crazy before that, I would be afterwards 😱😀
As well as that, an approximate 1watt sine wave on a sensitive full range driver is a very loud noise by the time you get to the midrange and treble, so much so that I'd have to leave the room during each test, and I don't think my neighbours would be too chuffed either. 😛
Since the reason for this set of tests was only to determine changes in resonance, I restricted the measurement range to 20-40 Hz for the Visaton, and 30-60Hz for the Coral, wide enough to show well down the skirts of the peak and clearly see where the peak is. (Which I believe LIMP finds precisely by interpolating the zero crossing of phase, if it falls between two test frequencies)
Because I wasn't going above 60Hz on unmounted drivers I was able to drive them quite hard without making a lot of noise.
I then entered the data into Excel by hand and plotted it.
For the impedance curve I attached in my post (you might have missed that one ?) I increased the measurement range to 20-100Hz, but otherwise settings were identical, so you can see the quality of curves that were being measured by that.
As far as trying to eliminate measurement procedure goes, I think the stepped sine method is pretty fool proof, but to be sure I did a test with a good old analogue sine wave generator, a 680 ohm resistor driven from a power amp, and a multimeter to measure the voltage across the speaker, and looked for the impedance peak at different signal levels and confirmed a downwards trend with increasing drive level.
Hope that answers any questions you might have about measurement procedures.
Last edited:
See my prior post to this for more info about my measurement set up. I might try some other drivers, I have a small Jordan tucked away, I might try measuring that, it's about the "most different" driver I have to the other two, apart from a couple of 4" mid-bass drivers in some bookshelf speakers.This makes me wonder if the measuring system isn't an issue? You might try the resonance vs. level of a couple of very different drivers to see if they all have similar resonance shift.
That's the assumption I was working under too.Frankly I have never measured resonance vs. drive level. I know it is an issue at high levels so I stay away from high level measurements. Always assumed measurements below a certain threshold would be similar.
What I'd already done was measure the apparent T/S parameters both at small signal levels, and moderate excursion levels, enter them both as different drivers (in WinISD pro) and then done two different simulations for the same box design for the two "different" drivers overlaid to see the difference between the small signal and large signal response. From that you can get an idea of how the response will change between small and large signals, knowing that the spectrum of possible variations in response will lie between those two extremes.If you want to get on with your life then use parameters from your medium strength measurements. The rest is more of academic interest.
Great idea on the lissajous patterns - I never thought of using those for this type of measurement, I can see how it would show the effect you're talking about, however I suspect the "error" may be less than a line thickness on the scope, thus hard to resolve. I'll give it a try anyway.One interesting test is a lissajous pattern of voltage vs. current.
Lissajous curve - Wikipedia, the free encyclopedia
This would be on an oscilloscope in XY mode with voltage for one axis and current (voltage across a drive resistor) for the other axis. It should give a diagonal line or slim ellipse near resonance. Probably something different in your case.
Last edited:
"Bullock on Boxes" is superb. It was written as comptuer power was starting to allow automated measurement.Also Robert M. Bullock III, had several good dissertations on T/S and achieving accurate Vas measurements, I have one of his books, "Bullock On Boxes."
He makes extremely knowledgeable recommendations.
It shows how to do all the measurements manually and he shows how to use the computer to do the arithmetic.
But more important than any of that, he explains the physics in a way that everyone can understand.
BTW,
his software is available on the net for free. Very rudimentary but you can see the science at work.
I don't understand your resolution difficulty.I tested both drivers from about half Xmax (0dB on the graph) all the way down to -54dB, where measurement noise started to impact the results - in fact there may be a small error in the -54dB and -48dB readings that is obscuring what is probably a plateau.
I regularly T/S test at your -50dB to -60dB level. Resolution is not an issue.
1Vac through 1k0 & 8ohm speaker leaves ~8.0mVac across the driver. That is -56dB ref 5.3Vac
I think you have a repeatability issue due to your testing/measuring methods.
Edit:
I have just read post37. Forget software that you cannot check and cannot understand.
Do the testing manually.
Once you have a handle on what works and what needs accuracy, then you can use computer aided shortcuts. But only after you are able to recognise any errors that the computer may spew out.
Last edited:
- Status
- Not open for further replies.
- Home
- Loudspeakers
- Multi-Way
- Help understanding the physics of Vas