This is the standard approach from who play daily with simulations.The actual clear answers you got from several people so far, is that none of your five "THD simulations" hold sufficient information to valid a clear answer on preference. - Got it? 😉
Only playing with real world and thousands of lab test you (MAYBE) can understand something.
And each system amp-loudspeaker is a story, unique.
Walter

Hej nabo,
Unfortunately another answer where you prefer to complicate the simple question, about how a harmonic profile should be. As you although seem to have understood what it is all about, this is about a well known DHT output tube at low signal without a driver tube, to give distortion cancellation to get fooled by. This well known tube is normally accepted even if its THD on its own is over 2% at normal levels.
Unfortunately another answer where you prefer to complicate the simple question, about how a harmonic profile should be. As you although seem to have understood what it is all about, this is about a well known DHT output tube at low signal without a driver tube, to give distortion cancellation to get fooled by. This well known tube is normally accepted even if its THD on its own is over 2% at normal levels.
Waltube, why not in detail show how you evaluate harmonic profiles, instead of, as always, having a negative approach?
Mine is not negative approach, I think I have a right approach with the stuff I play.Waltube, why not in detail show how you evaluate harmonic profiles, instead of, as always, having a negative approach?
After more than 40 years of test lab and building amps MAYBE I have understood something.
And aren't simulations.
I repeat, the most important test is THD vs frequency at different level and you can start from resistive load. Then there is a THD vs level, also starting from resistive load so you can see how good is the OT trafo first and the the drive circuit
Of course a good frequency response at open loop ( if FB is connected) is prefereable !
Also because with s.e. the Zout normally is not so low and it interact with real load.
Unless the amp is transformerless, where do the bends in
the OPT fit into these Simulations. Difficult to hear most
tubes without that. And finding a good model of an OPT
can be difficult. Copper R's & iron losses don't cover the
bend in the BH curve.
To me simulations are a good start to check if an amp will work.
On paper, That is all.
And the speakers themselves will have an order of magnitude
more D% than most amps these daze. That is what we finally hear.🙂
This is very important.And the speakers themselves will have an order of magnitude
more D% than most amps these daze. That is what we finally hear.🙂
Indeed what we could do with our amps, is understand how to "partially manage" speaker distortion working in the full amp as we do when we cancel output stage distortion with driver distortion. Within a very specific range of volume at which we often listen to... or just enjoy the music and that's it.
Whoever said an OPT was involved😉?
About the harmonic profile, my theory is that 2nd order distortion will mask the higher order odd harmonics to a certain extent.
Question is how much of the premier is needed to do the job?
In my examples, only 2H diminished with lighter load, giving lower THD, which might fool a few.
About the harmonic profile, my theory is that 2nd order distortion will mask the higher order odd harmonics to a certain extent.
Question is how much of the premier is needed to do the job?
In my examples, only 2H diminished with lighter load, giving lower THD, which might fool a few.
Last edited:
Your picture names suggest, that simulation done maybe as choke loaded 6B4G, parafeed (?) connected OPT.
1.) This isn't "simple" SE.
2.) The used 6B4G tube model IMO not "perfect" (notedly as perfect, as mathematical model follows the reality), in my practice shows -level dependent- false values.
To declare under such conditions (not knowing the actual measuring/simulating criterion) anything, nothing that state generalities.
And in A/B testing, the difference between 0.07THD and 0.11THD isn't audible at any listening level. Maybe on paper you can see it, you'll never hear it.To me simulations are a good start to check if an amp will work.
On paper, That is all.
Have you seen the 2nd how is displayed on a scope?About the harmonic profile, my theory is that 2nd order distortion will mask the higher order odd harmonics to a certain extent.
In a s.e. of course
It can't mask the others until reach the square wave ( less or more)
Walter
I give up, leaving this thread!
It is not about the circuit, where the examples are taken from!
It is not about a specific SE!
It is about the relationship between mainly 2nd and 3rd harmonic and the higher odd harmonics!
Why not google "harmonic profile" or "distortion profile"?
One example of many:
https://audioxpress.com/article/a-single-ended-e-linear-power-amplifier
Again, you have to study the test on real world when the amp is connected to real load.It is about the relationship between mainly 2nd and 3rd harmonic and the higher odd harmonics!
The harmonics will change with the modulus, phase of the speakers and level specially in a s.e. where the OT plays a heavy roles. And this is dynamic
If you understand this you can see that your question can't have an answer.
Walter
"Figure 12 shows the spectrum at 10W. At this power level, you lose the ideal harmonic profile, as the 3rd harmonic has become larger than the 2nd. This is typical of most amplifiers - as they approach clipping, distortion becomes more symmetrical, and the odd harmonics start to increase. This is still not so bad, as there is plenty of 2nd and 4th harmonic to help mask the 3rd."
Hmm....
Pete a little optimistic .....
As many of them suggested, the theory (including simulation) it's like a pudding: 'The proof of the pudding is in the eating'
If you can see the waveform of scope any signal, where H3 reaches or exceeds H2, you experience that H2, H4 nothing helps on brutally distorted waveform: it's bad, regardless of H2, H4.
Sample:
Average (EH) 300B SE at 10W (clipping asymmetrically).
The green is the grid voltage, the red is the output.


As you can see in pic1, the driver "harmonic profile" is monotonous decreasing (H2>H3>H4) -very low 0.38% THD-, at the output harmonics H3 exceeds H2 and H4 almost reaches H2 (1.65% THD).
No free lunch, this harmonic profile belongs to distorted output signal as can see on pic2.
If the simulation shows such output harmonics (emerged H3), in the reality the amplifier will distort heavily.
Until the H2..H4 are monotonous decreasing, the amplifier will producing lower THD, than near clipping state.
Some real test on a s.s. 2A3 with resistive load, 8 ohm, different level. 1 kHz
Input stage is a Gomes.
1w

2,5 w

clipping

Is possible to see the shapes of FFT, in the clipping a lot of harmonics come on, almost a square wave
In the previous two the shape is possible to see a reasonable shapes, as theory says.
Walter
Input stage is a Gomes.
1w
2,5 w
clipping
Is possible to see the shapes of FFT, in the clipping a lot of harmonics come on, almost a square wave
In the previous two the shape is possible to see a reasonable shapes, as theory says.
Walter
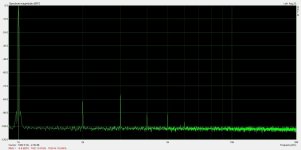
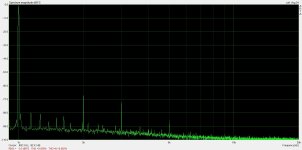
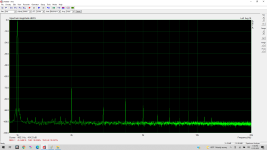
These are real distortion measurements from a SET amp that I built. I tested several different output tubes in this amp, which resulted in different distortion spectra. All measurements attached here were taken at 1W out.
Anyone care to guess which one I think sounded the best?
Anyone care to guess which one I think sounded the best?
Attachments
All those Spectra look like there is PS problems.Some real test on a s.s. 2A3 with resistive load, 8 ohm, different level. 1 kHz
See the spike up against the LHS.🙂
well if you can hear a sig. difference I speculate graph number 2. as it has 2nd harmonics leading, and a nice diminishing slope from there to 5th harmonic. At 77db down though it will be pretty quiet all in all.Anyone care to guess which one I think sounded the best?
I certainly like the way that one looks the best, but honestly, I don't think I could tell the difference between the way any of them sound if my life depended on it.
I'm not sure I could tell the difference between the ones in the first post, either. I start to feel like something is different when things hit about .5% at 1W.
I'm not sure I could tell the difference between the ones in the first post, either. I start to feel like something is different when things hit about .5% at 1W.
Normally I would say the second plot: it has just 2nd and 3rd harmonics, with the former dominant.Anyone care to guess which one I think sounded the best?
But… because you ask, the right answer will probably be the less expected of the three, so the first plot has third dominant and the third plot with more harmonics than others.
I’ve read Pass’ posts where people preferring 2nd or 3rd harmonic dominant are quite balanced, so the less expected should be the third plot.
I vote for that.
- Home
- Amplifiers
- Tubes / Valves
- Harmonic pattern of SE