tinitus said:Just curious, but how big is the foam plug ... does it start at the throath and fill the whole waveguide, or does it only fill half the waveguide. or ... ?
Soongsc, a foam plug or other material in a waveguide may not be the same thing as a cloth in front of a dome tweeter or midrange cone
I would like to make the plug as big as possible, so yes, it fills the space as much as it can.
Hello David,
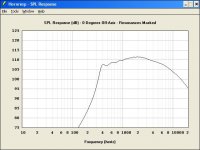
The on axis measured response of many compression drivers on different Le Cléac'h horns is always very flat (Nippon Gakki on AH160, Nippon Gakki on AH204, WE555 on Jerzual horn, B&C DE 250 on J321, TD4001 on J322, TD2001 on J321...)
With the TAD TD2001 compression driver mounted on a 320Hz Le Cléac'h horn the on axis response is flat until 19kHz. With a Fc =380Hz horn it is even flat until 23kHz!
But when using Hornresp and my TD2001 modelisation in which I am very confident, the power response is flat but the on axis response (0°) shows a slowly rising slope followed by a more rapid decreasing slope. I could never reproduce that behavior.
Best regards from Paris, France
Jean-Michel Le Cléac'h
David McBean said:
Hi Jean-Michel,
Just out of interest, how close is the 0 degrees off-axis directivity response prediction to the measured SPL response result shown in your attachment? (From the shape of the curve I am guessing that your attachment gives the predicted constant directivity or power response).
Thanks in anticipation.
Kind regards,
David
soongsc said:
While I understand this phenomena, I have never read anything that correlates prediction and measurement results. Is your paper to ALMA a presentation for or a paper form? I could not find any title on your site that seems related to this. Having looked throught the presentation titled "Sound Quality Improvements in compresson Driver Systems", it is addressed the HOM source could be from the driver itself, but does not address which is more significant, nor is there any way to distinguish between HOMs from guide or HOMs form driver. The frequency plots do indicate that it acts like a filter. This same filter also cuts out detail transients. Whether eq will linearize the effects caused by the foam, there is not data showing that.
Analysis on diaphragm vibration mode indicate that the diaphragm modes are very similare in nature to drum modes. When these modes interact with the compresson driver phase plug, we should be able to see the so called HOMs that coorelate with certain Axial modes of the diaphragm. I have not used compression drivers because this part of the design does not seem mature, but it's under investigation. Improve the diaphragm modes, and you reduce HOMs. I might just consider treating them like direct ratiating diaphragm to reduce the modes.
The paper that you mention is the one that I was talking about. It shows impulse responses with and without foam.
HOMs are different than diaphragm modes. They can be related, but these modes in compression drivers are generally above 10 kHz. The HOMs that I worry about are usually below 10 kHz.
The statement " This same filter also cuts out detail transients. " is not very scientific and exactly the kind of comment that was being discussed. What is a "detail transient". Any transient is the same thing as frequency response - correct one and you correct the other.
Jmmlc said:But when using Hornresp and my TD2001 modelisation in which I am very confident, the power response is flat but the on axis response (0°) shows a slowly rising slope followed by a more rapid decreasing slope. I could never reproduce that behavior.
This doesn't sound like very good correlation between real and simulated responses.
Originally posted by gedlee
HOM - Higher Order Mode, its a term that I coined to define waves that propagate in a waveguide that do not go down the axis, but travel by bouncing off of the walls. They are not predicted by the Horn Equation, so most people didn't even know that they existed (I was the first person to hypothesize there existance). The Waveguide Theory predicts them, and low and behold, it turns out that they are quite significant to audibility. Minimizing them yields a far better sound quality. But with "horns" its not possible to minimize them because you don't know what to do - the equations aren't rigorous enough to predict them so they are simply ignored.
---------------
This is interesting.
Are you suggesting that you were the first (or the only one) to realize that the waveform will suffer from reflections inside the horn (a phenomenon you designated as HOM)?
These reflections will of course lead to the sort of ripples in the spectrum that any delay-and-add propagation will create. But I can't believe that you imagine that you somehow discovered this phenomenon. Perhaps, this is exuberance on your part and the your comments were written in haste. Of course you did provide some useful modelling but ....
soongsc said:
While I understand this phenomena, I have never read anything that correlates prediction and measurement results. Is your paper to ALMA a presentation for or a paper form? I could not find any title on your site that seems related to this. Having looked throught the presentation titled "Sound Quality Improvements in compresson Driver Systems", it is addressed the HOM source could be from the driver itself, but does not address which is more significant, nor is there any way to distinguish between HOMs from guide or HOMs form driver. The frequency plots do indicate that it acts like a filter. This same filter also cuts out detail transients. Whether eq will linearize the effects caused by the foam, there is not data showing that.
Any kind of low-pass filter, be it acoustic or electronic, would be expected to remove the subjective "detail" of a loudspeaker. In other words, if there's no top octave, it won't sound "detailed." Some loudspeakers accentuate the top octave to make the presentation sound unnaturally detailed.
The key is that the foam is a low pass filter, but it's compensated by the crossover. Do you understand that it's a two step process? The two work in hand-in-hand. You can't just stuff a foam plug into any ol' speaker; you have to redesign the xover.
This is one of the reasons that you can't just cram a bunch of polyfill into the waveguide and expect reliable results. The foam is manufactured to exacting specifications, and the consistency of the foam PPI is a must for predictable results.
Jmmlc said:But when using Hornresp and my TD2001 modelisation in which I am very confident, the power response is flat but the on axis response (0°) shows a slowly rising slope followed by a more rapid decreasing slope. I could never reproduce that behavior.
Hi Jean-Michel,
Many thanks for the information. I would have thought that the attached on-axis response prediction was reasonably close to the measured response as shown in your Post #922, assuming that the “hole” at 1600 hertz is disregarded.
Am I missing something in the interpretation of your measured results, perhaps?
Kind regards,
David
Attachments
WithTarragon said:Originally posted by gedlee
HOM - Higher Order Mode, its a term that I coined to define waves that propagate in a waveguide that do not go down the axis, but travel by bouncing off of the walls. They are not predicted by the Horn Equation, so most people didn't even know that they existed (I was the first person to hypothesize there existance). The Waveguide Theory predicts them, and low and behold, it turns out that they are quite significant to audibility. Minimizing them yields a far better sound quality. But with "horns" its not possible to minimize them because you don't know what to do - the equations aren't rigorous enough to predict them so they are simply ignored.
---------------
This is interesting.
Are you suggesting that you were the first (or the only one) to realize that the waveform will suffer from reflections inside the horn (a phenomenon you designated as HOM)?
These reflections will of course lead to the sort of ripples in the spectrum that any delay-and-add propagation will create. But I can't believe that you imagine that you somehow discovered this phenomenon. Perhaps, this is exuberance on your part and the your comments were written in haste. Of course you did provide some useful modelling but ....
Is HOM the Quark of audio, or just the splashiness in most PA horns on high SPL?
WithTarragon said:Originally posted by gedlee
HOM - Higher Order Mode, its a term that I coined to define waves that propagate in a waveguide that do not go down the axis, but travel by bouncing off of the walls. They are not predicted by the Horn Equation, so most people didn't even know that they existed (I was the first person to hypothesize there existance). The Waveguide Theory predicts them, and low and behold, it turns out that they are quite significant to audibility. Minimizing them yields a far better sound quality. But with "horns" its not possible to minimize them because you don't know what to do - the equations aren't rigorous enough to predict them so they are simply ignored.
---------------
This is interesting.
Are you suggesting that you were the first (or the only one) to realize that the waveform will suffer from reflections inside the horn (a phenomenon you designated as HOM)?
These reflections will of course lead to the sort of ripples in the spectrum that any delay-and-add propagation will create. But I can't believe that you imagine that you somehow discovered this phenomenon. Perhaps, this is exuberance on your part and the your comments were written in haste. Of course you did provide some useful modelling but ....
Any discussion of horns that is based on Webster's horn equation cannot discuss waves other than axial ones. This is because this theory assumes only axial waves. In 1991 I described a different form of analysis for "horns" that uses a full 3 dimensional equation based directly on the wave equation. While I was not the first to solve these equations I was the first to apply them to the use of waveguides for transducers. This can be readily confirmed by simply looking up the papers.
With this new set of equations one can calculate the wave motion in a full 3 dimensional case, something which Webster's horn equation cannot do. So while others may have hypothesized the existance of non-axial wave motion, no one before me had shown mathematically how or when this could occur. This is what I meant by the "discovery".
Now, if you believe that there were others who discussed this problem with something more than a simple hypothetical or hueristic treatment then I'd love to have the reference as I know of no such writings.
salas said:
Is HOM the Quark of audio, or just the splashiness in most PA horns on high SPL?
Well I don't know what "splashiness" is, but I would tend to describe the HOMs and axial internal reflections as causing a harshness or coloration effect which increases with SPL making the horn not very pleasant to listen to.
gedlee said:
Well I don't know what "splashiness" is, but I would tend to describe the HOMs and axial internal reflections as causing a harshness or coloration effect which increases with SPL making the horn not very pleasant to listen to.
Turn the lights off and you'd never know the Summas are horns.
That's splashiness. The louder it goes the more it spits. Its very well known to reinforcement people as a characteristic bad sound. Must be HOM related.
Summa is HOMless.😀
Summa is HOMless.😀
This is quite possible, and is precisely why we should look at data, which gedlee had pointed out below.tinitus said:Just curious, but how big is the foam plug ... does it start at the throath and fill the whole waveguide, or does it only fill half the waveguide. or ... ?
Soongsc, a foam plug or other material in a waveguide may not be the same thing as a cloth in front of a dome tweeter or midrange cone
Ah, on page 38. I did not notice two impulses overlapped. I will try to elaborate on reading the impulse. The part before the main impulse and after will be explained individually.gedlee said:
The paper that you mention is the one that I was talking about. It shows impulse responses with and without foam.
HOMs are different than diaphragm modes. They can be related, but these modes in compression drivers are generally above 10 kHz. The HOMs that I worry about are usually below 10 kHz.
The statement " This same filter also cuts out detail transients. " is not very scientific and exactly the kind of comment that was being discussed. What is a "detail transient". Any transient is the same thing as frequency response - correct one and you correct the other.
If we look at the part prior to the main peak, without the foam there are little wriggles, im my measurement experience, the closer these wriggles resemble the reference impulse, the more detail the driver can deliver. I do not know whether there is a mathematical explanation for this, but this is what I find. Notice that with the foam, the little wriggles are not evident anymore if I read the picture correctly. To me, this means reduction in detail.
If we look at the part after the main peak, we can see that the foam has successfully filtered out the high frequency modes. I see these high frequency modes on direct radiating drivers with metal diaphrams as well, and make drivers very unbareable under certain music conditions. The foam does a good job filtering these out. But I'm quite sure these are originating from the compression driver diaphragm.
Now for HOMs below 10KHz, I kind of wonder whether they are induced structurally be radial and bell modes. These modes are similar to cones of drivers. I can see the more shallow the guide/horn is, the more easier they are excited unless the horn/guide is contructed with a well dampped material. Didn't you use some composite material for this purpose?
I think I fully understand this part, but the part that most people don't understand is that acoustic filters distort low lwvel signals differently from electronic signals. Send a 40db 10KHz sine wave through the foam and record before and after the foam to see how they differ in shape.Patrick Bateman said:
Any kind of low-pass filter, be it acoustic or electronic, would be expected to remove the subjective "detail" of a loudspeaker. In other words, if there's no top octave, it won't sound "detailed." Some loudspeakers accentuate the top octave to make the presentation sound unnaturally detailed.
The key is that the foam is a low pass filter, but it's compensated by the crossover. Do you understand that it's a two step process? The two work in hand-in-hand. You can't just stuff a foam plug into any ol' speaker; you have to redesign the xover.
This is one of the reasons that you can't just cram a bunch of polyfill into the waveguide and expect reliable results. The foam is manufactured to exacting specifications, and the consistency of the foam PPI is a must for predictable results.
soongsc said:
... the part that most people don't understand is that acoustic filters distort low lwvel signals differently from electronic signals. Send a 40db 10KHz sine wave through the foam and record before and after the foam to see how they differ in shape.
This is simply not true.

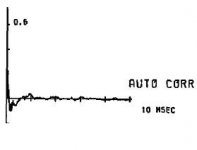
Auto-correlation would tell you the time arrivals of various parts of the wave, except that it would also be mixed in with the frequency response and any noise in the measurement.
Better would be to use the cross-correaltion of the input with the output as this would then normalize out the frequency response component and ignore the noise, yielding just the time of arrival data. This later techniques is exactly what I do. This result is also called the impulse response.
Hence, its impossible to say much from your data, other than the previous one is more likely to be the better sounding device as the second one rings on in time quite a bit. But the second one could also have a lot of noise in the measurement as this would also show up as an extended time aspect.
gedlee said:
This is simply not true.
I don't have your foam, so I can't test. Some disadvantage in this part of the discussion.
😀
gedlee said:This later techniques is exactly what I do. This result is also called the impulse response.
Hence, its impossible to say much from your data
I see
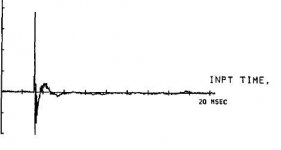
here is impulse response measurement of the horn of the "better looking" auto-correlation measurement
what can be said about it? is it good/bad/mediocre?
is it significantly worse than in case of Summa?
best,
graaf
Attachments
- Home
- Loudspeakers
- Multi-Way
- Geddes on Waveguides