Invoice recived and payed.
However after install and choice of rtx6001 I get error msg MMSYS_INVALHANDLE.
SW starts 2 windows up oscilloscope and spectrum analyzer bothe with the trial text. This on win10.
Update!
Setting card to asio got sw starting.
/örjan
However after install and choice of rtx6001 I get error msg MMSYS_INVALHANDLE.
SW starts 2 windows up oscilloscope and spectrum analyzer bothe with the trial text. This on win10.
Update!
Setting card to asio got sw starting.
/örjan
Last edited:
Dear lemon,
Have you checked your spam / junk email folder by chance? You should have received your PayPal invoice from Virtins by now (yesterday). You were (are) # 2 on the MI Pro GB list and your email / data were all sent to Virtins.
I’m literally on my way out of the net right now and will go dark (no Internet for me until 6 or 7 Aug). I will ask Virtins to re-send your PayPal invoice again prior to my departure. Thanks for letting me know. We’ll definitely get you sorted out my friend!
V/R,
MI Pro
I search all the folders to my gmail and there isn't.
Thanks for the interesting, I will wait for the resend email.
email address confirmation
I have just PM you. Please confirm the email address. Thanks a lot!I search all the folders to my gmail and there isn't.
Thanks for the interesting, I will wait for the resend email.
Unable to change sample rate
I don't understand how to change the sample rate for the RTX6001 within MI. Multiple rates are listed in the ADC/DAC database for the RTX6001, but the sample rate combo box at the top of the user interface is grayed-out.
I've tried both the custom RTX6001 driver and the standard ASIO driver. Both exhibit the same behavior.
I am probably missing something obvious. Can someone please clarify this?
I was there as well at first. You need to stop the sampling and then you can adjust settings. The green dot in the upper left is the start stop for the adv side. The source panel has a red or green arrow to start the source.
I hope this helps.
I hope this helps.
Three Oscilloscope Modes
Data acquisition (for both Oscilloscope and Spectrum Analyzer) can be started / stopped by clicking the round button at the upper left corner, or ENTER key.
Data output (for signal generator) can be started / stopped by clicking the triangle button on the signal generator panel, or ENTER key when the signal generator panel gets the input focus.
In MI, there are three oscilloscope modes:
1. Normal Oscilloscope Frame Mode
Data acquisition can be started / stopped through the round button at the upper left corner of the screen or ENTER key.
Under this mode, a data frame will be sampled when the specified trigger condition is met. There may be discontinuity between the two adjacent data frames. The length of the data frame is, by default, equal to the oscilloscope frame width, which can be selected by clicking anywhere within the oscilloscope window and then selecting “T” range at the lower left corner of the screen. (Note: do not select “Record” in the “T” range unless you want to switch it to Record mode). The sampling and triggering parameters can be changed on-the-fly.
2. Record Mode
Data acquisition can be started / stopped through the Record button at the upper right corner of the screen.
Under this mode, after being triggered, data will be streamed directly to a WAV file (by default Record1.wav, Record2.wav…. under \wav subdirectory of the software) in the hard disk. Meanwhile the screen will still be updated. The former recording process will be given the highest priority to ensure no discontinuity in the recorded WAV file even if time-consuming analysis is being performed on the screen-displayed data. To change the frame width under Record Mode, go to [Setting]>[Display]>”Record Mode”>”Frame Width”. During recording process, the sampling and triggering parameters can be NOT changed on-the-fly. They grey out.
Please refer to Section 2.12 of the software manual for details.
3. Roll Mode
Roll Mode can be activated by ticking the “Roll” option in the Sampling Parameter Toolbar (first toolbar from the top). It is useful for viewing a slow varying signal such as ECG.
Please refer to Section 2.13 of the software manual for details.
For audio analyzer application, the “Normal Oscilloscope Frame Mode” should be used in most of the cases.
I don't understand how to change the sample rate for the RTX6001 within MI. Multiple rates are listed in the ADC/DAC database for the RTX6001, but the sample rate combo box at the top of the user interface is grayed-out.
I've tried both the custom RTX6001 driver and the standard ASIO driver. Both exhibit the same behavior.
I am probably missing something obvious. Can someone please clarify this?
Data acquisition (for both Oscilloscope and Spectrum Analyzer) can be started / stopped by clicking the round button at the upper left corner, or ENTER key.
Data output (for signal generator) can be started / stopped by clicking the triangle button on the signal generator panel, or ENTER key when the signal generator panel gets the input focus.
In MI, there are three oscilloscope modes:
1. Normal Oscilloscope Frame Mode
Data acquisition can be started / stopped through the round button at the upper left corner of the screen or ENTER key.
Under this mode, a data frame will be sampled when the specified trigger condition is met. There may be discontinuity between the two adjacent data frames. The length of the data frame is, by default, equal to the oscilloscope frame width, which can be selected by clicking anywhere within the oscilloscope window and then selecting “T” range at the lower left corner of the screen. (Note: do not select “Record” in the “T” range unless you want to switch it to Record mode). The sampling and triggering parameters can be changed on-the-fly.
2. Record Mode
Data acquisition can be started / stopped through the Record button at the upper right corner of the screen.
Under this mode, after being triggered, data will be streamed directly to a WAV file (by default Record1.wav, Record2.wav…. under \wav subdirectory of the software) in the hard disk. Meanwhile the screen will still be updated. The former recording process will be given the highest priority to ensure no discontinuity in the recorded WAV file even if time-consuming analysis is being performed on the screen-displayed data. To change the frame width under Record Mode, go to [Setting]>[Display]>”Record Mode”>”Frame Width”. During recording process, the sampling and triggering parameters can be NOT changed on-the-fly. They grey out.
Please refer to Section 2.12 of the software manual for details.
3. Roll Mode
Roll Mode can be activated by ticking the “Roll” option in the Sampling Parameter Toolbar (first toolbar from the top). It is useful for viewing a slow varying signal such as ECG.
Please refer to Section 2.13 of the software manual for details.
For audio analyzer application, the “Normal Oscilloscope Frame Mode” should be used in most of the cases.
Spectrum Analyzer windowing
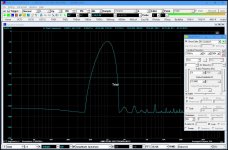
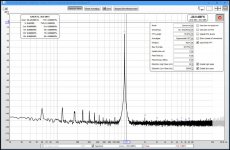
I'm unable to obtain similar performance results using MI vs Room Equalization Wizard. None of the FFT window settings in MI result in a narrow bandwidth rendering of the carrier when a pure 1 kHz tone is looped back into the RTX6001 on channel 0. Each of the MI window settings changes the shape of the carrier, but they're all much wider than I'm accustomed to seeing in other programs such as REW, ARTA and my own custom applications.
The reported THD is degraded in MI vs REW and ARTA. REW and MI are both restricting distortion calculations within the 20-20kHz band. REW is broadband, so its figures are slightly and expectedly higher.
Perhaps I'm improperly configuring MI. Please review the attached screen shots and diagnose.
Attachments
Last edited:
Invoice paid. Ironically, I just returned from 1wk in Singapore and it would have been great to say hello @ virtins HQ and maybe even hand carry my dongle home!
BK
BK
I'm unable to obtain similar performance results using MI vs Room Equalization Wizard. None of the FFT window settings in MI result in a narrow bandwidth rendering of the carrier when a pure 1 kHz tone is looped back into the RTX6001 on channel 0. Each of the MI window settings changes the shape of the carrier, but they're all much wider than I'm accustomed to seeing in other programs such as REW, ARTA and my own custom applications.
The reported THD is degraded in MI vs REW and ARTA. REW and MI are both restricting distortion calculations within the 20-20kHz band. REW is broadband, so its figures are slightly and expectedly higher.
Perhaps I'm improperly configuring MI. Please review the attached screen shots and diagnose.
MI has a few differences in its operation from the other programs you showed. Key first step when looking at spectrum is that you need to go to the waveform display and change the duration. You probably need 1 second (lower left option when waveform is selected) as a starting point. Then it collects 1 second worth of samples and processes the selected FFT size from that set of samples. If you select say 262K and you are sampling at 192K you should select a longer sample time (2 sec.) to get enough samples or it fills in with zeros. It's probably collecting more like .1 second and doesn't have enough info to get the selected resolution.
1audio -
Thank you for responding. Certainly, if using a time record that is too short, the FFT resolution will degrade.
I consider this a user interface flaw. The FFT is continuously updated and its size is controllable directly on the toolbar on the bottom of the main window. This leads users to believe that the program will capture a time record sufficiently large to allow processing of the FFT at the indicated size!
Attachments

The beta team has had some discussions about this as well. I believe there are some revisions in process. The system was designed as a digital scope with FFT which helps explain the focus on waveform.
Time range
I apologize for my previous post - it was too harsh. In fact, MI's behavior is similar to digital oscilloscopes, which also exhibit degraded FFT resolution at longer time/division scales.
In MI, the bottom toolbar changes functionality depending on which window has focus. The time range combo box is not displayed on the toolbar when the spectrum analyzer has focus and during my initial experiments, I'd closed the oscilloscope window. So, I couldn't see any controls related to time range.
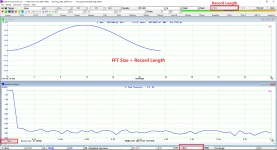
Record Length vs FFT Size
In Multi-Instrument, Record Length is the number of samples in the oscilloscope. The data sampling length is based on the Record Length not FFT size. FFT size is a parameter for analysis only. Record Length determines the max. frequency resolution achievable while FFT size determines the apparent frequency resolution. For example, if the Record Length is 2s, then the max. frequency resolution achievable is 1/2s = 0.5Hz. Whether it is achieved or not depends on the apparent frequency resolution, which is equal to [Sampling Frequency] / [FFT size] and is displayed at the lower left corner of the spectrum analyzer.
To change the Record Length, click anywhere within the oscilloscope window and select the T range at the lower left corner of the screen.
While other software might force [Record Length] = [FFT Size] to keep things simple, MI gives more weight to flexibility. It allows the following three configurations:
1. When [FFT size] > [Record Length], Number of FFT segments <1, thus zero padding will be used in the analysis.
2. When [FFT size] = [Record Length], Number of FFT segments =1.
3. When [FFT size] < [Record Length], Number of FFT segments >1, intra-frame average will be used in the analysis.
Where [Number of FFT segments] = [Record Length] / [FFT size]. It is displayed at the lower left corner of the spectrum analyzer. All the above three are useful for some applications. Some brief explanation on this topic can be found in Section 6 of the Quick Start Guide for RTX6001 and MI integrated system (http://www.virtins.com/RTX6001-Multi-InstrumentQuickStartGuide.pdf).
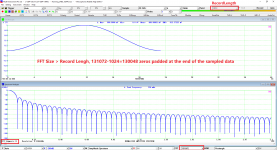
The following is an example showing that the above Case 1 (zero padding) is critical in some cases. In the \wav\window subdirectory of MI, there are 24-bit 1024-points wave files for 55 window functions. They can be loaded into MI to display their spectra. (Note that [Spectrum Analyzer Processing]>”Intra-Frame Processing”>”Remove DC” must be unticked for this case.)
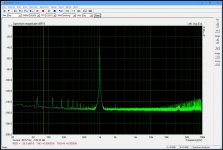
The first screenshot shows a Hann Window with [FFT size] = [Record Length] = 1024, the resulting spectrum is very coarse and inaccurate.
The second screenshot shows Hann Window with [FFT size] (131072) >> [Record Length] (1024), the resulting spectrum is very good and as expected.
There are many other cases where forcing [FFT Size] = [Record Length] is really a limitation of the measurement system.
In Multi-Instrument, Record Length is the number of samples in the oscilloscope. The data sampling length is based on the Record Length not FFT size. FFT size is a parameter for analysis only. Record Length determines the max. frequency resolution achievable while FFT size determines the apparent frequency resolution. For example, if the Record Length is 2s, then the max. frequency resolution achievable is 1/2s = 0.5Hz. Whether it is achieved or not depends on the apparent frequency resolution, which is equal to [Sampling Frequency] / [FFT size] and is displayed at the lower left corner of the spectrum analyzer.
To change the Record Length, click anywhere within the oscilloscope window and select the T range at the lower left corner of the screen.
While other software might force [Record Length] = [FFT Size] to keep things simple, MI gives more weight to flexibility. It allows the following three configurations:
1. When [FFT size] > [Record Length], Number of FFT segments <1, thus zero padding will be used in the analysis.
2. When [FFT size] = [Record Length], Number of FFT segments =1.
3. When [FFT size] < [Record Length], Number of FFT segments >1, intra-frame average will be used in the analysis.
Where [Number of FFT segments] = [Record Length] / [FFT size]. It is displayed at the lower left corner of the spectrum analyzer. All the above three are useful for some applications. Some brief explanation on this topic can be found in Section 6 of the Quick Start Guide for RTX6001 and MI integrated system (http://www.virtins.com/RTX6001-Multi-InstrumentQuickStartGuide.pdf).
The following is an example showing that the above Case 1 (zero padding) is critical in some cases. In the \wav\window subdirectory of MI, there are 24-bit 1024-points wave files for 55 window functions. They can be loaded into MI to display their spectra. (Note that [Spectrum Analyzer Processing]>”Intra-Frame Processing”>”Remove DC” must be unticked for this case.)
The first screenshot shows a Hann Window with [FFT size] = [Record Length] = 1024, the resulting spectrum is very coarse and inaccurate.
The second screenshot shows Hann Window with [FFT size] (131072) >> [Record Length] (1024), the resulting spectrum is very good and as expected.
There are many other cases where forcing [FFT Size] = [Record Length] is really a limitation of the measurement system.
Attachments
I apologize for my previous post - it was too harsh. In fact, MI's behavior is similar to digital oscilloscopes, which also exhibit degraded FFT resolution at longer time/division scales.
In MI, the bottom toolbar changes functionality depending on which window has focus. The time range combo box is not displayed on the toolbar when the spectrum analyzer has focus and during my initial experiments, I'd closed the oscilloscope window. So, I couldn't see any controls related to time range.
I was looking for someone with a REW perspective - at present, I use REW for the RTA and find that it works quite well. It has no hidden settings so what you see is what you get. The pop up dialog for the settings changes the display in real time. Do you find any advantages to using the new software that is offered in this GB over REW that you can highlight?
xrk971 -
I am not yet familiar enough with MI to elaborate on all of its advantages. I purchased MI for the following reasons:
1. Supports the National Instruments PXI-4461 dynamic signal analyzer for vibration measurements. The NI soft front panels for the 4461 is very limited.
2. Supports auto-scaling on the RTX-6001.
3. Provides a means of performing a sequence of preconfigured, standard tests.
4. Ability to log data in real-time from DAQmx devices or sound cards for post analysis.
I still like REW and it is my preferred audio-band spectrum analyzer. Simple, uncluttered interface, polished graphics. Works well with a USB mic to characterize a room. Equally useful when measuring the response of low-level transducers in conjunction with lock-in amplifiers.
I was looking for someone with a REW perspective - at present, I use REW for the RTA and find that it works quite well. It has no hidden settings so what you see is what you get. The pop up dialog for the settings changes the display in real time. Do you find any advantages to using the new software that is offered in this GB over REW that you can highlight?
Dear xrk971,
Thank you for your questions. I think REW is superb software so if you’re happy with it, I would wholeheartedly recommend you continue using it. For room acoustic or loudspeaker type of measurements in particular, I think it is really top notch.
A specific example of where I feel REW is superior to many other loudspeaker impedance measuring programs is its use of a driver impedance model that incorporates elements that cater for Frequency-Dependent Damping (FDD). The model is described in detail in the paper by Thorborg, Tinggaard, Agerkvist & Futtrup,"Frequency Dependence of Damping and Compliance in Loudspeaker Suspensions" J. Audio Eng. Soc., Vol. 58, pp. 472-486 (June 2010). - - See the REW help menu and the AES paper for more details. IMO this type of model is reflective of how REW’s programmer (John Mulcahy) is using more modern research which he incorporates into his wonderful software.
I feel the same way about ARTA as I do REW, i.e., I think it too is great software. For example, ARTA’s application note # 7, entitled: “Estimation of Linear Displacement with STEPS” is also highly unique (assuming one has the Baumer OADM 20I6441/S14F displacement laser, a suitable measurement microphone and test jig, etc.).
The point I’m trying to make is that different software brings different capabilities to bear and it depends on the end users unique measurement requirements insofar as what software to use. It is a situation dependent type of affair, so I don’t believe there is a universal type of audio analyzer software that does 100% of every measurement that a given end user may desire, ergo I say, use more than one.
So coming full circle back to your question, i.e., what does this GB MI Pro software over that of REW? Again, it is a situation dependent type of affair type of answer IMO. Having said this, I can say that the main advantages MI Pro has over REW are as follows:
1. For individuals who have purchased the very high quality RTX6001 audio hardware, it is a no-brainer mainly for the super ease of calibration (I’ve posted on this functionality before in this MI Pro GB forum – please see my posting # 241).
2. The ability to measure far more psychoacoustically relevant nonlinear audio distortion parameters like GedLee (Gm distortion) and non-coherent distortion + noise (NCD+N), (I’ve posted on this functionality before in this MI Pro GB forum – please see posting # 1).
3. A quick comparison and contrast type of mini-review conducted by Stuart Yaniger in AudioXpress Magazine comparing REW, RMAA, audioTester, ARTA vs. MI, etc. can be seen at this URL: Practical Test & Measurement: Sound Cards for Data Acquisition in Audio Measurements (Part 3) | audioXpress. A full review by Stuart Yaniger of MI can be found here: Practical Test & Measurement: The Virtins Multi-Instrument Software | audioXpress.
4. Paragraph # 3 highlights some of the key differences between the various audio analyzer software programs from an independent party that has no dog in the fight. I’m very happy with the conclusions he makes when comparing MI software to the competition, but again, I personally still find uses for retaining the use of ARTA and REW as per my earlier comments.
Finally, I do take exception to your choice of wording, to wit: “…It has no hidden settings so what you see is what you get…” What you call “hidden settings” is simply a different GUI that resides within an audio analyzer program that has more features, ergo more GUI options to choose from. There is always a learning curve that accompanies the use of any new powerful software program and so it is with MI software as well, (as evidenced by the comments made by Stuart Yaniger in the two URLs cited above).
Once one takes the time to learn the GUI of MI they will quickly discover that it offers a lot of powerful features and customizability that its competitors lack IMO. There is always an inverse relationship between a given software’s’ power vs. the ease of use, and since MI is arguably trending towards the powerful feature rich side, there resides more initial complexity in learning how to use it, but the end user is handsomely rewarded in spades by taking the time to do so IMO.
I hope the above helps to answer your questions concerning some of the differences between MI and some of the other great audio software that exist out there like REW, ARTA, etc.
V/R,
MI Pro
- Home
- Group Buys
- GB for Virtins MI Pro for RTX6001 autoranging/autoscaling & for soundcard end users