v goes down with frequency
Z will be different for each driver and frequency depending on the roomnode it exites.
So maybe high Z for some drivers at some frequencies provides enough SPL even if just some drivers contribute to the SPL. Then other drivers will contribute at other frequencies and it all add up sufficiently?
Z will be different for each driver and frequency depending on the roomnode it exites.
So maybe high Z for some drivers at some frequencies provides enough SPL even if just some drivers contribute to the SPL. Then other drivers will contribute at other frequencies and it all add up sufficiently?
I think it could come down to different peoples experiences or expectations. Most people won't have heard a speaker like this as they are not common, that is why I think it is important to listen to the thoughts of people who have, nothing wrong with asking questions or wanting something different for yourself.It's a difference beeing a neysayer and be supprised🙂
The resonance frequency does change depending on the enclosure used and that sets the low frequency rolloff. By using EQ that can be changed to mimic whatever response is desired just like a linkwitz transform. The penalty for using more EQ is that more power needs to be used to compensate.Just to clarefy Fs:
free air reference efficency is dependent on fs^3
In most cases there are a link between this value, max SPL and the max SPL possible at frequencies below fs.
That is why in a design like this the amplifier power tends to be the limiting factor rather than Volume displacement. It takes an amplifier bigger than most people have available to get these to x-max with lots of EQ.
He ( Hank) is right, a woofer in OB works with velocity 🙄
Becauseee....
( it has to do with Z of air and the reactive part and the resistive part, plus the excursion 😱)
I think Hank was referring to the audiophile "speed" rather than the fact that a dipole works as a velocity transducer instead of a pressure transducer (monopole) 😉
Could be 🙂v goes down with frequency
Z will be different for each driver and frequency depending on the roomnode it exites.
So maybe high Z for some drivers at some frequencies provides enough SPL even if just some drivers contribute to the SPL. Then other drivers will contribute at other frequencies and it all add up sufficiently?
Not direct link but via some other formulas that also depend on Fs. So follow the Fs and you will see the dependencies🙂
http://www.diyaudio.com/forums/full-range/303417-full-range-tc9-line-array-cnc-cabinet-50.html
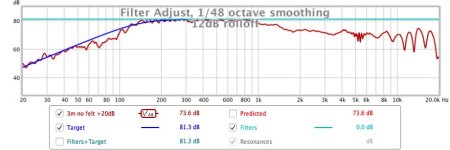
It looks like the normal 12 dB/oct closed box fall under f-3dB for single driver.
In the array outdoor measurements it looks like it falls att a higher rate. Is it just higher Q value?
http://www.diyaudio.com/forums/full-range/303417-full-range-tc9-line-array-cnc-cabinet-50.html
It looks like the normal 12 dB/oct closed box fall under f-3dB for single driver.
In the array outdoor measurements it looks like it falls att a higher rate. Is it just higher Q value?
Last edited:
It looks like the normal 12 dB/oct closed box fall under f-3dB for single driver.
In the array outdoor measurements it looks like it falls att a higher rate. Is it just higher Q value?
I think it is just the scale of the graph that is making it look steeper.
I have calculated the Q from the impedance response and it came out at 0.8.
Here is an image with a 12dB slope with a -3dB point at 140Hz. Seems to match pretty well to me.
Attachments
I don't understand people's fascination with fs. It's just the point where the impedance is high. I'm sure it matters if we're driving with a constant power or voltage, but we're not.
It's analogous to a feedback system. With application of enough power you can coerce the system to follow whatever transfer function you like, until something breaks of course. Only difference here is that eq is a feedforward compensation rather than the usual feedback in a servo system
It's analogous to a feedback system. With application of enough power you can coerce the system to follow whatever transfer function you like, until something breaks of course. Only difference here is that eq is a feedforward compensation rather than the usual feedback in a servo system
Fs: dictates the f-3 frequency via VAS. Under f-3 frequency cone execurtion raises sharply in closed box. (A resonator in the box negates the sharp rise)
Most people don't like to drive their element into the unlinear region of the voice coil. Especially if the driver also is used in midrange or HF
Most people don't like to drive their element into the unlinear region of the voice coil. Especially if the driver also is used in midrange or HF
Thank you fluid. I im thinking of what causes the 'dip' between 50 and 100 hz.
I am not 100% sure but some of it depends on where the target line should be drawn. With the line array gain being frequency dependant it is tricky to know exactly where the standard sealed box roll off starts. If I draw the target line to coincide with the output at 1K it looks much different. I drew if for a reasonable fit with a -3dB point at 140Hz as that is the predicted resonant frequency for my enclosure which matches closely to the measured impedance.
I think the reason that it does not follow a totally flat curve is that it is a composite of 25 drivers each with differences in raw response.
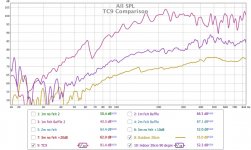
Here is a comparison of some TC9 measurements two by me at 20cm one indoors one outdoors and the other by Byrtt. They are not exactly the same.
That is true but it is not what is being done here. The driver is being driven below resonance certainly but there are 25 drivers to share the load so each one is only doing a little bit each.Fs: dictates the f-3 frequency via VAS. Under f-3 frequency cone execurtion raises sharply in closed box. (A resonator in the box negates the sharp rise)
Most people don't like to drive their element into the unlinear region of the voice coil. Especially if the driver also is used in midrange or HF
I don't want to stifle discussion but as Perceval said earlier the subjects of Fs Vd etc have been discussed to breaking point, I think everyone has made it clear where they stand on those topics.
Attachments
Think dip between 50 and 100Hz will need other methods to investigate if its really there or not, myself live on the country and even i think here is nice silence then below 200Hz looking at a RTA is a really scary picture, and think those noise probably sum to measurements because its noise floor sits so relative high and we probably need a ladder more than few meters to get really clear of it.

Into picture there is also the possibility there's a little overshoot if we could measure more reliable down there, TC9 is high Q(ts) device and most other simulators show a little final system overshoot, for Rephase example above data is Q 0,7071 verse Q 1,0. My own TC9 measurement think show little overshoot signs even mounted on OB and it could be investigated further with a close near-field measurement, but that close near-field measurement method would probably not work for measuring tight spaced line array.
Above is mostly theory and hard to really check out in a home environment as diy'ers, think what really matters is what wesayso and other builders had shown that when placed in a cooperating room and calibrated at listening position these systems can show impressing data and sound performance.
About volume displacement torgeirs, try think about race engines that if multiple many pistons verse fewer is allowed within same final volume class then often it wins some way on performance and flexibility, for speakers we can add pistons/volume at positions all over the room but it looks these line array multiple piston systems when inside a real room can perform in time as they mounted on same crankshaft verse all over the room spread crankshafts will add to performance but probably difficult to have them turn in sync with each other.
Attachments
Last edited:
Yes, at least I have exausted my viewpoints of old textbook Fs, F-3dB, sensitivity, explanations of the measurements you have kindly provided.
My real reason for interest is wall subwoofer application. An array of small subs in the wall in all 4 corners of a room is an intriging solution to sub that can be hidden in an normal norwegian wood - isolation - wood wall.
It can be installed in new house and afterwards speakers can be set up without having to think about low frequencies eg < 70 Hz.
An other sourse of inspiration is Harmans whitepaper on multi subs.
My thinking that if 50 tc9 can give sufficient SPL and THD in room for normal listening levels, an array of long throw (10mm, low fs 36 Hz) d=15 cm, VAS=16, box = 5 l, can generate really high bass SPLs and still fit in an normal norwegian wall
I write this not to defere on your application, just to say that we can learn from one topic and use it on another.
Last edited:
Think dip between 50 and 100Hz will need other methods to investigate if its really there or not, myself live on the country and even i think here is nice silence then below 200Hz looking at a RTA is a really scary picture, and think those noise probably sum to measurements because its noise floor sits so relative high and we probably need a ladder more than few meters to get really clear of it.
Into picture there is also the possibility there's a little overshoot if we could measure more reliable down there,
There is an important difference between an RTA and a logsweep measurement. The logsweep has an inverse filter applied and it results in a very high signal to noise ratio. It does a very good job of rejecting environmental noise if the signal level is high enough.
I was very disappointed with my outdoor measurements until I turned the level up. Once I got it up to 80dB signal I got a very good measurement.
I got these as high off the ground as I reasonably could. Lifting a 2m+ heavy tower onto a higher table is not something I plan to do 🙂
I actually think that the directivity of the speaker in the vertical plane means I can get away with it.
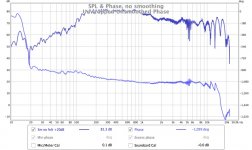
Here is a graph with unwrapped unsmoothed phase I think it is good to 20Hz before environmental noise takes hold. I do have plenty of others that look nothing like that though (too low signal) 😉
I measure my Q at 0.8 so there is a little bump before rolloff. If I reduced the target level in that graph by 0.5dB or so that would account for the Q bump.
Attachments
My real reason for interest is wall subwoofer application. An array of small subs in the wall in all 4 corners of a room is an intriging solution to sub that can be hidden in an normal norwegian wood - isolation - wood wall.
It can be installed in new house and afterwards speakers can be set up without having to think about low frequencies eg < 70 Hz.
An other sourse of inspiration is Harmans whitepaper on multi subs.
My thinking that if 50 tc9 can give sufficient SPL and THD in room for normal listening levels, an array of long throw (10mm, low fs 36 Hz) d=15 cm, VAS=16, box = 5 l, can generate really high bass SPLs and still fit in an normal norwegian wall
I write this not to defere on your application, just to say that we can learn from one topic and use it on another.
That actually sounds like a very good idea. The Harman paper has good information but they only put the subs on the ground for obvious reasons. If you can change the vertical height that can have a big impact too.
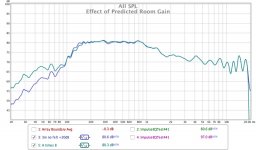
Your post got me thinking about Byrtt's room gain simulation. I read a post by Jeff Bagby recommending to switch it to power response rather than axial response which makes sense.
I used the boundary simulation only as the pressure gain was mainly below 30 Hz and was constant anyway.
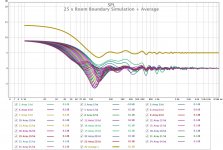
I have simulated each of the 25 drivers separately at their heights where the towers are currently positioned in my room. Individually there are some horrible dips but when averaged together it is a very nice curve, yay 🙂
I think this can be used to backup the claim that the arrays work very well in a typical room as compared to a speaker at a single height. The single speaker needs to be moved away from walls to avoid interference whereas the array can be closer getting the boundary loading without so many of the serious dips.
Here is a graph of the average offset 5dB from the individual responses.
I then did an A*B of the array plus simulated boundary gain compared to outdoors, about 8dB of help at 30Hz.
Attachments
Thanks , I hope it looks as nice when I measure in reality, no doubt there will be reflections that spoil the party 🙂Interesting curves and good work fluid ...
I have been playing around getting DRC up and running so I can use it with in room measurements.
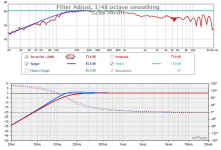
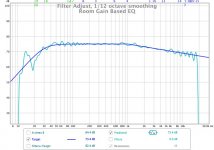
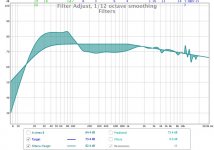
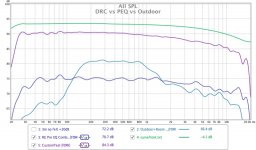
Here is a graph that shows a comparison of a DRC correction (purple), vs a virtual file of an outdoor measurement combined with predicated room gain and some pre EQ (dark blue). The other traces are the outdoor measurement (aqua) and the target response (green).
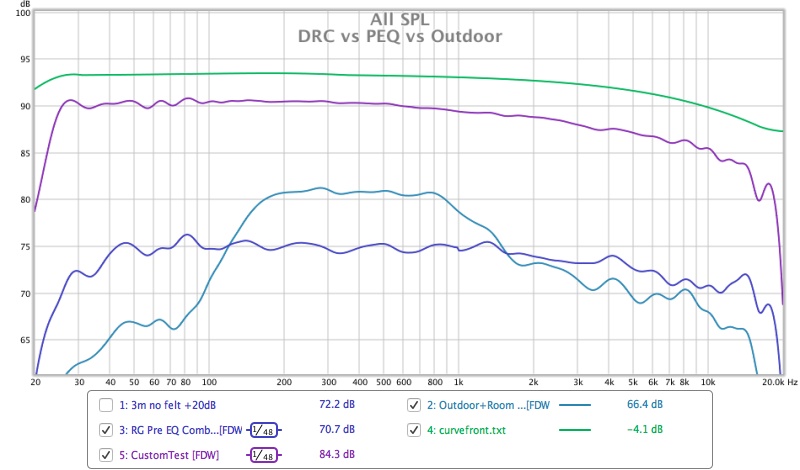
I have used a 6 cycle FDW in REW as this shows the differences quite well, (as DRC has made it's calculations based on a FDW), the raw graphs are better but harder to see the differences without zooming in more.

In the above graph I used gmad's custom minimum phase template. The phase is pretty straight!
I'm going to try Wesayso's sample DRC file next to see what the changes in windowing do.
I will be interested to listen to these different corrections versus basic EQ and then DRC based on averaged in room measurements to compare the different strategies.
Here is a graph that shows a comparison of a DRC correction (purple), vs a virtual file of an outdoor measurement combined with predicated room gain and some pre EQ (dark blue). The other traces are the outdoor measurement (aqua) and the target response (green).
I have used a 6 cycle FDW in REW as this shows the differences quite well, (as DRC has made it's calculations based on a FDW), the raw graphs are better but harder to see the differences without zooming in more.
In the above graph I used gmad's custom minimum phase template. The phase is pretty straight!
I'm going to try Wesayso's sample DRC file next to see what the changes in windowing do.
I will be interested to listen to these different corrections versus basic EQ and then DRC based on averaged in room measurements to compare the different strategies.
Attachments
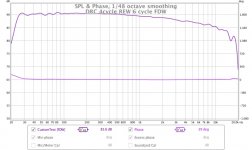
Nice results fluid and they probably sounds really good, a comment could be the purple correction would probably improve a bit in rhytm feel if phase exactly follow amplitude using "Generate minimum phase" button to show the phase target differences from that pretty straight purple phase curve, that said take your time to investigate the different corrections and comparisons.
Nice results fluid and they probably sounds really good, a comment could be the purple correction would probably improve a bit in rhytm feel if phase exactly follow amplitude using "Generate minimum phase" button to show the phase target differences from that pretty straight purple phase curve, that said take your time to investigate the different corrections and comparisons.
Not if you drag the perfectly corrected speaker into a room that's average 🙂.
In my opinion we can't separate the room from the speaker and vice versa...
Unless we live/listen in rooms with anechoic like conditions....
Not if you drag the perfectly corrected speaker into a room that's average 🙂.
In my opinion we can't separate the room from the speaker and vice versa...
Unless we live/listen in rooms with anechoic like conditions....
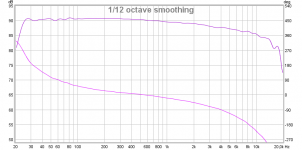
I get a little confused what you mean and also not sure if purple curve fluid showed is in room at listening position or it is some synthetic predictions, below is extracted minimum phase for fluid's amplitude curve isn't that what to target at listening position if actual room will allow it to be possible ? 🙂
Attachments
- Home
- Loudspeakers
- Full Range
- Full Range TC9 Line Array CNC Cabinet