Running the C128 - just put on some Diana Krall - very nice! Rater, more like very, very nice!!! Sounds good on both 16/44 & 24/384 albeit a tiny bit more atmosphere and space in the music with the high frequency input.
Out of interest is the 24/384 up sampled in software or is it a hi-res version of the same recording?
I briefly listened to zfe's NOShalf filter as well, found it to be excellent. Did not have time to do extended comparison between NewNOS, C128 and NOShelf. But love to hear other peoples opinions.
Søren has said that the filters reload whenever the loses a lock on input.
Just make sure you see feedback on the terminal/putty that indicates the DAM has locked to a sample rate, i.e. L044.
You should get Ix, L044, V-xx whenever the DAM relocks.
Code:# exit I1 L044 V-35 I2 I1 L044 V-35
Try using I3 if you only have one active input, and remember you need to enter the Ix twice when you first exit from uManager. The DAM will not respond the first time.
Exactly what I need to know, thank you!
I also began comparing 44.1k flac's to vinyl releases and its to the point now where the DAM is making me feel like my vinyl collection/turntable was a waste of money.
My overlap between vinyl and digital is not that huge (and you also do not know if not something was altered between the two releases).
However I can not yet say that I would throw away my vinyl for the digital. There are sometimes distortions on the vinyl (mostly dynamic issues I think) that are not at the digital side, which is somehow a bit cleaner. But I have the impression that the vinyls have a bit more body, are somehow less flat (if that makes any sense).
The most obvious difference is that I frequently can listen relaxed to vinyls at a volume that I do not support for a long time on the digital side.
Of cause this may be some technical problem with the dynamic (or the HF comming through) somewhere in my chain.
While 1021filtNQ_C128x110 is perfect for listening, can always criticize it is not perfect at high frequency. A manufacturer needs to make one more perfect frecuency response to look good with the press.
Until you can get a gradual transition IP filter, you can make an IP filter previous approach, would be to half of short NQ filter, and later to half of long NQ filter like this or more long.

Until you can get a gradual transition IP filter, you can make an IP filter previous approach, would be to half of short NQ filter, and later to half of long NQ filter like this or more long.
Attachments
Last edited:
Hi Paul, Yes, I guessed as much. Thank you however, for making the point. Until now (having now built the Dac into the case with all inputs available) I've been using the optical input switching between 16/44 and 24/96 on the PC. I tend to think this offers a 'more realistic' comparison, likewise arguably 16/44 and 24/384, to immediately hear the difference between 'filter in/filter out’. I have been listening principally to 24/96 material, theory being the file has the maximum resolution available - assumes the recording, production, etc, is of high order and not some compressed junk! I have a couple of 384k files somewhere for testing, but have yet to try them out. I use a TAG McLaren DVD32 as CD transport, will connect that up at some point and have a listen. I've also a TAG AV192 to fix, which has a 2-way digital connection between DVD to sync clocks, etc. Be interesting to compare CD between an 'all TAG' setup and our Dac.
I have now fired up NI Signal Lab, Tektronix Edition, and connected up the scope. Going to have a play, will report back. Last night was still unable to get the FFT plot to show the noise floor anything below about -70/80dB at best, way higher than I expect.
I have now fired up NI Signal Lab, Tektronix Edition, and connected up the scope. Going to have a play, will report back. Last night was still unable to get the FFT plot to show the noise floor anything below about -70/80dB at best, way higher than I expect.
The only way I can see that issue can be addressed is to make the filter steeper but that would require a longer filter and more ringing. I think it might be possible to tweak so the time smear is shifted higher but that will require some experimentation.
Some thoughts on IR spectrograms and time smear detection.
I think they should be done with a broader perspective: FR up to 100k and at least 120-140dB of dynamic range.
85dB is insufficient - too flattering, we can't really see the ringing.
The analyzer software do some averaging, so the real amplitudes are at least 30db higher.
140dB is more revealing, "log squared" 🙂
Examples below (done with SoX).
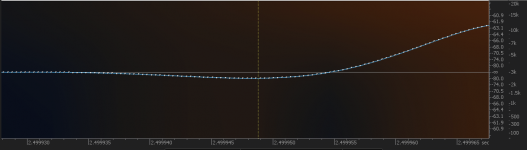
IR of an IP filter, upscaling from 44k to 352k, 85dB:

Nice! No ringing 😀
If we dig a little deeper...

With 140dB we start to see something.
Finally, full scale DR:

Now we see everything, even the dither @ -140dB. The ringing starts from around 17kHz and should be inaudible.
While it is clear what the log square impulse response tells us, it is just the plot of the magnitude of the filter coeficents in dB, I am not so sure about the actual information content of the spectrogram of the impulse response.
There is nothing such as spectral distribution of a single sample. What is done is you pick an certain amount of the samples (of the impulse response in our case), by multiplying it with an suitable placed "window". Then do the DFT which gives you a frequency distribution. Then move the window ahead some samples and repeat the process.
The narrower you choose the window the better is your time resolution, but the coarser the frequency resolution.
So what we see is the frequency response of the part of the impulse currently under the window plus effects of the chosen window function.
As the impulse response contains relatively few samples, it is probably more important than usual to choose the parameters (time resolution, windowing function) carefully so that you see some detail information of the impulse response and not only of the applied window sliding over some kind of peak.
Again, I am no expert in digital audio processing, I just try to understand the theoretical part, and see here potential dangers. Maybe I am totally wrong.
Jaffar/zfe...
The point here is as Pflaumer indicates in his patent is that a log representation of the impulse is better correlated with what we hear than linear representations.
Secondly, Pflaumer indicates that only smear above -80dB has any audible effect.
I find it a pretty useful tool, and it seems to reflect what I'm hearing.
Of course if you feel the need to stick to textbook approved theory or plots that show the movement of atomic particles you are more than welcome to do so...
The spectrogram is done with Isotope RX which uses Auto adjusting Short-time Fourier Transform, and the window is a Kaiser beta = 20.
Remember that I am analysing the single sample after if has been up sampled using FIR1 and FIR2. There are well over 1000 samples within the length of the sample, not just one...
Attached is a screen shot of the very start of the ringing of an impulse showing the sample points. Obviously there a few more than one.
Attachments
Last edited:
Jaffar/zfe...
The point here is as Pflaumer indicates in his patent is that a log representation of the impulse is better correlated with what we hear than linear representations.
Secondly, Pflaumer indicates that only smear above -80dB has any audible effect.
I find it a pretty useful tool, and it seems to reflect what I'm hearing.
Of course if you feel the need to stick to textbook theory or plots that show the movement of atomic particles you are more than welcome to do so...
Ay 😕 What in my post goes in the direction you complain about.
I do not complain about squared log and only say you need to be carefull to interpret the Elephant diagrams.
Ay 😕 What in my post goes in the direction you complain about.
I do not complain about squared log and only say you need to be carefull to interpret the Elephant diagrams.
I didn't mean to suggest that you were dismissing the log squared representation - I know you would have jumped in much earlier on that one if it had been an issue.
I'd also edited the post add information about the spectrogram and number of samples, obviously whilst you were replying.
Been trying my level best to make sensible measurements using my scope (even read the manual!) and tools on the PC. I can measure impulse timings, ringing, spectruam analysis, but have been unable to resolve my high noise floor issue at around 70dB down. Unless perhaps I'm mixing up my dBs, power and voltage. Manual says 0dB represents 1V. Will think on that one. Anyway, I've started using the best measuring tools I have - my ears!
One small point which I think has already been noted, with the NOS filters I can see the digital signal coming through from the DAC, but the audio signal is clean with, for example, the C128 filter.
I've connected the CD player (Tag DVD32) - using the C128 filter, very nice indeed. My favourite for now. Hope to get the TAG porcessor running in the next day or two to compare.
Been trying my level best to make sensible measurements using my scope (even read the manual!) and tools on the PC. I can measure impulse timings, ringing, spectruam analysis, but have been unable to resolve my high noise floor issue at around 70dB down. Unless perhaps I'm mixing up my dBs, power and voltage. Manual says 0dB represents 1V. Will think on that one. Anyway, I've started using the best measuring tools I have - my ears!
The output of the DAM can be much higher than 1V = 0dB, which is probably your issue. Send the DAM a 0dBFS signal and check the output levels with a multimeter. The unbuffered out should give you 1.4V RMS with an "full gain" filter i.e. one set to x8, or the NOS filters with 8 coefficients. The filters I do usually have x6.833 gain (-3.5dB on the x8) and it's been reported by DimDim that these give 1.0Vrms on the unbuffered outs. Buffered are higher than this, I believe 2.0V RMS for RCA and 4.0V balanced.
Just came across a couple of papers on time smearing. Just had a quick scan but seems interesting.
http://boson.physics.sc.edu/~kunchur/align.pdf
http://boson.physics.sc.edu/~kunchur/temporal.pdf
http://boson.physics.sc.edu/~kunchur/align.pdf
Misalignment in timing between drivers in a speaker system and temporal smearing of signals in components and cables have long been alleged to cause degradation of fidelity in audio reproduction. It has also been noted that listeners prefer higher sampling rates (e.g., 96 kHz) than the 44.1 kHz of the digital compact disk, even though the 22 kHz Nyquist frequency of the latter already exceeds the nominal single-tone high-frequency hearing limit fmax∼18 kHz. These qualitative and anecdotal observations point to the possibility that human hearing may be sensitive to temporal errors, τ, that are shorter than the reciprocal of the limiting angular frequency [2πfmax]−1 ≈ 9 μs, thus necessitating bandwidths in audio equipment that are much higher than fmax in order to preserve fidelity. The blind trials of the present work provide quantitative proof of this by assessing the discernability of time misalignment between signals from spatially displaced speakers. The experiment found a displacement threshold of d≈2 mm corresponding to a delay discrimination of τ≈6 μs.
http://boson.physics.sc.edu/~kunchur/temporal.pdf
This work investigates the temporal resolution of human hearing through its discrimination of the time constant of low-pass filtering applied to a periodic signal. While restricting the bandwidth affects both the amplitude spectrum and temporal definition of the signal, the direct amplitude changes in this experiment fall below their just noticeable differences. The discrimination therefore seems to be sensitive to phase in addition to spectral amplitude differences. An upperbound of τ ≈ 5 μs was obtained for the threshold time constant, showing that human temporal resolution extends down to time scales shorter than found in the past.
Last edited:
And this AES paper by Alexey Lukin and Jeremy Todd of Izotope discusses the Adaptive STFT used in RX.
http://citeseerx.ist.psu.edu/viewdoc/download?doi=10.1.1.62.6362&rep=rep1&type=pdf
This is the conclusion of the paper:
http://citeseerx.ist.psu.edu/viewdoc/download?doi=10.1.1.62.6362&rep=rep1&type=pdf
This is the conclusion of the paper:
We have demonstrated a general framework for effective multiresolution signal processing and analysis. This framework avoids several undesirable side effects of the STFT's fixed time-frequency resolution such as the smearing of events in both time and frequency. It allows signal processing and analysis to adapt its resolution according to a predetermined strategy or the analysis of local signal features. We have shown how this framework can be applied to the display of spectrograms, spectral subtraction algorithms for noise reduction and center channel extraction algorithms.
I do not complain about squared log and only say you need to be carefull to interpret the Elephant diagrams.
That was my point, too.
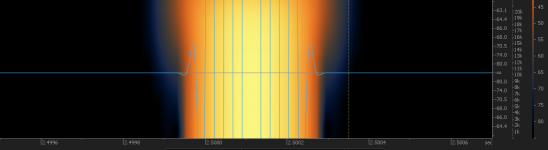
Look at the Elephant spectrogram, the main "body" of the impulse is yellow (-30dB) which is untrue. Therefore with only 85dB of DR we are unable to detect any ringing in the range from -55 to -80dB. Even with Isotope's auto adjusting STFT it will be mapped as black.
Secondly, Pflaumer indicates that only smear above -80dB has any audible effect.
That was my point, too.
Look at the Elephant spectrogram, the main "body" of the impulse is yellow (-30dB) which is untrue. Therefore with only 85dB of DR we are unable to detect any ringing in the range from -55 to -80dB. Even with Isotope's auto adjusting STFT it will be mapped as black.
The highest level of the main body in the spectrogram is actually -12dB, so -30dB is a bit wayward.
But all that rather misses the point. I'm treating the spectrogram as a potentially useful schematic for visualising the effect of the filter settings, not as some absolutely accurate measure of impulse behaviour.
The relationship is a bit easier to see with the impulse waveform zoomed so -85dB (approx) is the minimum on the amplitude axis. The edges of the main "body" match the start and end of ringing.
For what it is worth the onset of "spread"/"smear" is related to the start of roll-off in the filter. The filter has very low levels of roll-off at 13kHz and the "body" spread begin around this point.
A question for you and zfe...
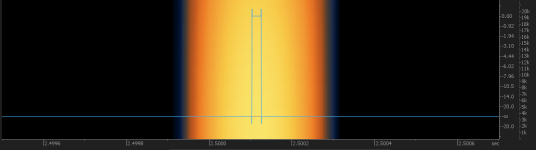
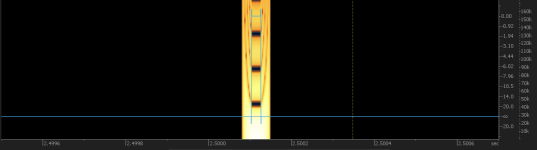
If this is just frequency related artefacts from the window function, why is the spectrogram of the NOS filter clear of any "smear", and only shows the main body with sinc roll-off causing a narrowing of width?
Attachments
Last edited:
A question for you and zfe...
If this is just frequency related artefacts from the window function, why is the spectrogram of the NOS filter clear of any "smear", and only shows the main body with sinc roll-off causing a narrowing of width?
For beeing able to better reverse ingeneer what are the actual things happening, could you please tell me
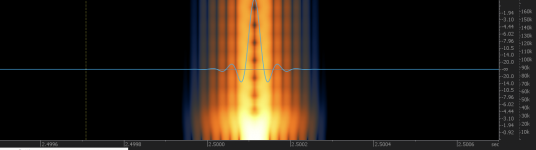
1. If the thin blue line is a representaion of the (NOS) filter (so giving an idea of the width (samples/fs) of the filter in relation to the spectrogram).
2. If that is FIR1 or FIR1+FIR2.
3. finally please give me a spectrogram with a ferquency range up to 88.2 or better 176.4kHz. At the higher frequencies things should become visible that help.
P.S. and perhaps also give me the analog spectrogram choosing for the STFT the rectangular window, instead of Kaiser, if possible.
Last edited:
For beeing able to better reverse ingeneer what are the actual things happening, could you please tell me
1. If the thin blue line is a representaion of the (NOS) filter (so giving an idea of the width (samples/fs) of the filter in relation to the spectrogram).
2. If that is FIR1 or FIR1+FIR2.
3. finally please give me a spectrogram with a ferquency range up to 88.2 or better 176.4kHz. At the higher frequencies things should become visible that help.
P.S. and perhaps also give me the analog spectrogram choosing for the STFT the rectangular window, instead of Kaiser, if possible.
Impulse .wav attached.
1. The blue line is the impulse waveform as plotted by RX. The spectrogram is at the same zoom level and position.
2. FIR1+FIR2
3. ok had a second to do... after all.
C128 and NOS with rectangle window and 176.4kHz, but a bit like walking back 25m and saying "It's OK, I can't see your wrinkles in the photo now..."
Attachments
Last edited:
- Home
- Source & Line
- Digital Line Level
- Filter brewing for the Soekris R2R