I have some data exported from one of my spectrum analyzers placed into a CSV file. It basically contains 2048 samples of an FFT placed upon a 1K sine wave through one of my amplifiers.
I do not have my textbooks in front of me now so my question is how do you compute THD based upon this information using excel?
All I need is an equation for hanning. Also it would be helpful for hamming, blackman, and the other common windowing functions.
Thanks,
kingneb
I do not have my textbooks in front of me now so my question is how do you compute THD based upon this information using excel?
All I need is an equation for hanning. Also it would be helpful for hamming, blackman, and the other common windowing functions.
Thanks,
kingneb
The spectrum analyzer performs all the computation except for THD. The wiki does not provide the information (at least that I can recognize) that takes the points from a hanning windowed plot and computes the THD from that. It does however perform all the windowing math on what is coming into the analyzer.
What I am asking is how to compute the THD based upon a hanning computed series of points.
What I am asking is how to compute the THD based upon a hanning computed series of points.
I do not have my textbooks in front of me now so my question is how do you compute THD based upon this information using excel?
If your question is how you can compute THD figure out of the amplitude of individual harmonics, the formulae are here:
Total harmonic distortion - Wikipedia, the free encyclopedia
George
No that is not the question, the question is, through individual sample points run through the hanning windowing function.
Ok, mis-understood your question. As gpapag pointed out in the Wiki - THD is simply the square root of the sum of the squares of the harmonic components divided by the fundamental.
Yes, I know that.
The magnitude of the harmonics calculation I am aware of. I am talking about computing it based upon each point in sample time.
The magnitude of the harmonics calculation I am aware of. I am talking about computing it based upon each point in sample time.
definitely Window function - Wikipedia, the free encyclopedia
Hann window may not be useful for low distortion levels <0.1% due to extended leakage spectrum
Hann window may not be useful for low distortion levels <0.1% due to extended leakage spectrum
Last edited:
The windowing is done to increase spectral resolution. The THD is calculated the same way it always is. It's the power of the harmonic content divided by the power of the fundamental.
Total harmonic distortion - Wikipedia, the free encyclopedia
I'm not aware of any way to get the original samples back once you've performed the windowing. If you don't like the windowing, use a rectangular window.
~Tom
Total harmonic distortion - Wikipedia, the free encyclopedia
I'm not aware of any way to get the original samples back once you've performed the windowing. If you don't like the windowing, use a rectangular window.
~Tom
All I have is a bunch of points from a *.CSV off the spectrum analyzer. I do not see how the magnitude of each harmonic can be easily deduced from that information alone.
Is there a way to determine the THD just from all the points sampled in time?
Is there a way to determine the THD just from all the points sampled in time?
Last edited:
If I understand you correctly, you have the time samples - already processed by a Hanning window. You have to apply FFT to these to get frequency samples - or just code up a simpler but slower Fourier Transform. Then you determine things like harmonic levels from the FFT output. If you understand the discrete version of Fourier Transform then you can code it into a spreadsheet. If you don't understand it then you need to find someone to do it for you, or a library function in some suitable programming language. It may be (I'm not sure) that Excel or one of its extensions includes an FFT function.
Alternatively, you may already have the FFT output. Not clear from your description.
Alternatively, you may already have the FFT output. Not clear from your description.
What's in the .CSV? Time domain data? Frequency domain data? Garbage? You're not providing many details here...
If you have the time domain samples in your .CSV file, then apply the window function and run the FFT. This is fairly straight forward in MATLAB/Octave/FreeMAT or Mathcad. Good luck doing it in Excel. Not saying it can't be done, but it wouldn't be my first choice.
~Tom
If you have the time domain samples in your .CSV file, then apply the window function and run the FFT. This is fairly straight forward in MATLAB/Octave/FreeMAT or Mathcad. Good luck doing it in Excel. Not saying it can't be done, but it wouldn't be my first choice.
~Tom
Fast Fourier transform - Wikipedia, the free encyclopedia
As DF96 points out, you can run a straight Fourier Transform or Discrete Fourier Transform (DFT) as well. They're slower than the FFT (Fast Fourier Transform). The Fourier transform transforms from time domain to frequency domain. From there you can get the the amplitudes of the harmonics and calculate the THD.
~Tom
You can indeed do FFT in Excel- it's in the Analysis Tookpak. It's a bit laborious, but not difficult.
For finding THD you may be better off with a flat top window, which has better amplitude resolution than Hanning.
For finding THD you may be better off with a flat top window, which has better amplitude resolution than Hanning.
Something to try... Assuming the windowing function has been done, then:
1) Find fundamental in the proper bin from your data points (the highest one);
2) Find harmonics in their bins;
3) Calculate THD = sum of the powers of the harmonics divided by the power of the fundamental and the harmonics.
Jaz
1) Find fundamental in the proper bin from your data points (the highest one);
2) Find harmonics in their bins;
3) Calculate THD = sum of the powers of the harmonics divided by the power of the fundamental and the harmonics.
Jaz
I have some data exported from one of my spectrum analyzers placed into a CSV file. It basically contains 2048 samples of an FFT placed upon a 1K sine wave through one of my amplifiers.
kingneb
OK, you have a calculated 2K FFT CSV data file from a 1K sine data stream & Hamming FFT Window applied... the used sample rate is also important while this defines the FFT Bin frequency distance (SR / FFT size).
I do not have my textbooks in front of me now so my question is how do you compute THD based upon this information using excel?
kingneb
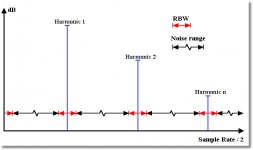
Look at the attached picture, to have an glue 😀 or use an analyzer who is doing it for you

All I need is an equation for hanning. Also it would be helpful for hamming, blackman, and the other common windowing functions.
kingneb
Only possible if you current analyzer allows to apply your required FFT Window function PRIOR the FFT calculation. May download my SW & use a valuable sound card (Free or Evaluation) and may search within the help file.
Hp
Attachments
- Status
- Not open for further replies.
- Home
- Amplifiers
- Tubes / Valves
- FFT Hanning Data