bandwidth
Hi Bob,
Thanks for the HP note reference, will try to find it.
I realize the noise floor I am talking about here is for the analyzer and not what would be recognized as the noise floor of my preamp or soundcard. If I understand, the integration of all of the peaks seen in the analysis, say the 0-500Hz data, would yield a noise reading pertaining to that bandwidth. Is it so? Will try to find a coax shorting plug so I can look at the internals of the analyzer.
Phillip,
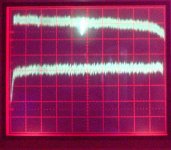
Here's some white noise 1Vrms in and out. Top trace is soundcard output 0-20kHz. Bottom trace is preamp 0-500Hz. I have the 0-20kHz for the preamp as well and it basically overlays onto the soundcard output. In a minute I'll add a pic of the 0-300kHz bandwidth that shows the shape of the soundcard filter and if it can be seen a small peak at 44.125kHz. Output is generated by the sig gen in WinISD.
Michael
Hi Bob,
Thanks for the HP note reference, will try to find it.
I realize the noise floor I am talking about here is for the analyzer and not what would be recognized as the noise floor of my preamp or soundcard. If I understand, the integration of all of the peaks seen in the analysis, say the 0-500Hz data, would yield a noise reading pertaining to that bandwidth. Is it so? Will try to find a coax shorting plug so I can look at the internals of the analyzer.
Phillip,
Here's some white noise 1Vrms in and out. Top trace is soundcard output 0-20kHz. Bottom trace is preamp 0-500Hz. I have the 0-20kHz for the preamp as well and it basically overlays onto the soundcard output. In a minute I'll add a pic of the 0-300kHz bandwidth that shows the shape of the soundcard filter and if it can be seen a small peak at 44.125kHz. Output is generated by the sig gen in WinISD.
Michael
Attachments
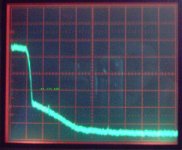
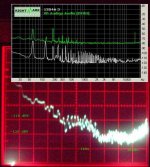
Analyzer self noise 0-500Hz
The picture speaks. These data were collected with the conditions used for the amp/soundcard traces above. That is
2048 transforms
0.625Hz resolution
64 samples averaged
All 70dB of available gain was applied for this sample.
Might be enough fun for one day.
Michael
The picture speaks. These data were collected with the conditions used for the amp/soundcard traces above. That is
2048 transforms
0.625Hz resolution
64 samples averaged
All 70dB of available gain was applied for this sample.
Might be enough fun for one day.
Michael
Attachments
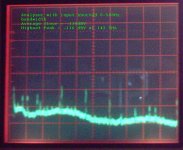
Pure WAG, but I'll wager that there's a variable gain amp somewhere that scales the input signal to something optimal for the A/D, and that's what the display is showing- you've got that amp cranked up to max gain. If you tried to put in a 1V signal, you'd overload it like crazy.
That's my guess, anyway.
That's my guess, anyway.
For sure
Absolutely blow it out of the water. It doesn't like overload at all and has a meter on the front that gives a pretty good indication of where the input level is. Also has an instant on overload light. You don't need it after you've seen the results of a few overloads though. Every harmonic you could ever want and then some.
As I mentioned (I think) it seems to have an 80dBV dynamic range, so when I am looking at a 1Vrms signal the floor is ~75-78dB down and overload is at just above +3dBV. Looking in the grass overload is at just some few millivolts, but right now my interest is in looking at what goes on in the supposedly quiet parts. Trying to see the power supply noise and the effects of component placement and the like.
A soundcard would be in many ways handier, but my computer isn't a boatanchor yet and I would feel quite bad if I crisped it. Also I think that when you have a program just spit out numbers for some specified number of harmonics and noise you never get a feeling for when the analyzer is misbehaving or when you're telling it to do something bad. So, perhaps foolishly, I am trying to combine several undertakings here, analyze my preamp and soundcard, analyze and learn the analyzer, familiarize myself with the vagaries of FFT analysis and frequently to kill some time in the way too early morning until I can put on some tunes without being on the receiveing end of brickbats.
Any idea of how to get phase data out of this?
Thanks,
Michael
Re: For sure
Phase is purely a relationship and therefore requires a comparison of 2 signals (called a transfer function), normally the input source vs. the device under test (DUT) output. Your analyzer will probably not handle this.
If you have a Mac you can download a free trail of Spectra-Foo at http://www.mhlabs.com this will perform the transfer function very elegantly. The PC equivalent is called Smaart Live, http://www.siasoft.com/ seems like they have a trial version too, not as nice as Foo but still pretty good.
audiobot said:Any idea of how to get phase data out of this?
Phase is purely a relationship and therefore requires a comparison of 2 signals (called a transfer function), normally the input source vs. the device under test (DUT) output. Your analyzer will probably not handle this.
If you have a Mac you can download a free trail of Spectra-Foo at http://www.mhlabs.com this will perform the transfer function very elegantly. The PC equivalent is called Smaart Live, http://www.siasoft.com/ seems like they have a trial version too, not as nice as Foo but still pretty good.
phase
Your probably right. There is a second analog input on the rear but it is probably not for a second signal. Oh well, just have to struggle along. Speaker Workshop gives phase info as well, if I recall. Also Audiotester.
Still of the opinion that those strange low frequency peaks are artifacts?
Michael
Re: phase
yes, on Spectra-Foo you can turn on a coherency display which tells you the "integrity" of the input signal, as the coherency drops I start to see peaks exactly as yours
audiobot said:Still of the opinion that those strange low frequency peaks are artifacts?
Michael
yes, on Spectra-Foo you can turn on a coherency display which tells you the "integrity" of the input signal, as the coherency drops I start to see peaks exactly as yours
Ok
Cool. Any significance to their occuring in the middle of the analysis band? Will try a smaller band, maybe tomorrow. Or try the zoom feature and see if that makes a difference.
Thanks,
Michael
Cool. Any significance to their occuring in the middle of the analysis band? Will try a smaller band, maybe tomorrow. Or try the zoom feature and see if that makes a difference.
Thanks,
Michael
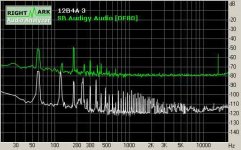
RightMark
I hooked up a loop through the 12B4A preamp today and ran their analysis suite. Here is a picture of the noise level graph. The soundcard data is raised 40dB in the graph for viewability.
Phil: notice the scurfy stuff around 250Hz
Will post comparison scope shots from the SA analyzer.
I hooked up a loop through the 12B4A preamp today and ran their analysis suite. Here is a picture of the noise level graph. The soundcard data is raised 40dB in the graph for viewability.
Phil: notice the scurfy stuff around 250Hz
Will post comparison scope shots from the SA analyzer.
Attachments
- Status
- Not open for further replies.
- Home
- Amplifiers
- Tubes / Valves
- FFT analysis-Truth or Consequence