Hi All,
I recently picked up an old Scientific Atlanta GPD350-6A Digital Signal Analyzer and am in the process of checking it out by analyzing my soundcards and a 12B4 preamp I built. I would appreciate any comments leading to a further understanding of FFT analysis, possible indications of equipment malfunction or misinterpretation of data. I will post a few scope shots of spectra and invite your comment.
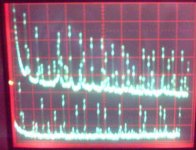
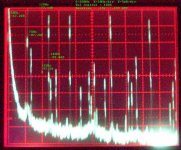
This first one is of the output of the preamp with no signal (top) and the output of the integrated Intel soundcard on my computer (bottom). Analysis from 0-1000Hz with 2048 transforms (1.25Hz bin?). Noise floor seems to be decreasing with frequency on the preamp and ends at -117 dB with respect to 1V. The soundcard noise floor seems to be -121 dB. The spectra are offset in the X-axis. For comparisons, the 60Hz signal is -74.4 dB from the preamp and -87.6 from the soundcard.
Voltage measured with an HP3490A voltmeter (uncalibrated) is 1.2mV from the preamp and 3.56mV from the soundcard. That seems a bit odd.
Anyway, does this seem reasonable, possible, impossible, unreasonable? Youir call.
Thanks,
Michael
I recently picked up an old Scientific Atlanta GPD350-6A Digital Signal Analyzer and am in the process of checking it out by analyzing my soundcards and a 12B4 preamp I built. I would appreciate any comments leading to a further understanding of FFT analysis, possible indications of equipment malfunction or misinterpretation of data. I will post a few scope shots of spectra and invite your comment.
This first one is of the output of the preamp with no signal (top) and the output of the integrated Intel soundcard on my computer (bottom). Analysis from 0-1000Hz with 2048 transforms (1.25Hz bin?). Noise floor seems to be decreasing with frequency on the preamp and ends at -117 dB with respect to 1V. The soundcard noise floor seems to be -121 dB. The spectra are offset in the X-axis. For comparisons, the 60Hz signal is -74.4 dB from the preamp and -87.6 from the soundcard.
Voltage measured with an HP3490A voltmeter (uncalibrated) is 1.2mV from the preamp and 3.56mV from the soundcard. That seems a bit odd.
Anyway, does this seem reasonable, possible, impossible, unreasonable? Youir call.
Thanks,
Michael
Attachments
1kHz test signal
Hi All,
I have used audio rightmark and various other soundcard based analysis programs. For a change I am trying this method. Comments on it's inferiority or superiority to soundcard analysis is welcomed.
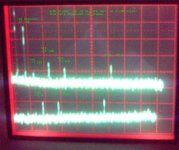
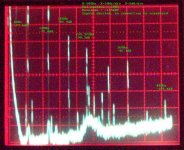
Here is a picture of the 1kHz data. The output of the soundcard was set to 1.020V and the output of the preamp adjusted with the volume control to provide 1.024V. The analyzer gives the level of the 1kHz sine at 1.01953V for both. The picture shows the number and level of the harmonics. The preamp adds a reasonable amount of 2nd, otherwise seems about the same levels for all. Small drop in 7th for the preamp re the sc is repeatable.
Seem reasonable?
Michael
Hi All,
I have used audio rightmark and various other soundcard based analysis programs. For a change I am trying this method. Comments on it's inferiority or superiority to soundcard analysis is welcomed.
Here is a picture of the 1kHz data. The output of the soundcard was set to 1.020V and the output of the preamp adjusted with the volume control to provide 1.024V. The analyzer gives the level of the 1kHz sine at 1.01953V for both. The picture shows the number and level of the harmonics. The preamp adds a reasonable amount of 2nd, otherwise seems about the same levels for all. Small drop in 7th for the preamp re the sc is repeatable.
Seem reasonable?
Michael
Attachments
12B4 preamp schematic
Will try to post the preamp schematic here. Have had varying luck with this operation in the past.
Very nice sounding, currently using it with my computer as source and driving vintage Crown DC300 with series stacked pairs of HPM40 for speakers. It has in the past seen duty in many other positions.
Michael
An externally hosted image should be here but it was not working when we last tested it.
schematic
Sorry guys, I'm either screwing up or the editor here is inserting a linebreak or something that I can't remove so the pic apparently won't post.
M.
Sorry guys, I'm either screwing up or the editor here is inserting a linebreak or something that I can't remove so the pic apparently won't post.
M.
series stacked pairs of HPM40
You are completely mad! An essential quality for an audiophile 🙂
Last time i had HPMs was in 1977. I wonder how they sound today.
Hey
I think I resemble that remark.
I think they sound pretty good. Frequency response may be a little ragged and a bit sibilant perhaps, but the sound is there. Certainly adequate for my computer/rear surrounds duty.
Any thoughts on the FFTs?
Michael
I think I resemble that remark.
I think they sound pretty good. Frequency response may be a little ragged and a bit sibilant perhaps, but the sound is there. Certainly adequate for my computer/rear surrounds duty.
Any thoughts on the FFTs?
Michael
FFT
Hi,
If you can digitize the input and output signals into and out of the preamp, I could FFT them for you. Any binary file would do, just let me know the structure.
You can then compare with the results of your instrument.
For understanding of Fourier series in the context of audio amplifiers, refer to Radiotron Designer's Handbook, Chapter 6, part 8 (I have right by my side 🙂).
Afraid of saying things you already know, I'll stop here.
Cheers,
Rada
Although I'm not familiar with this unit it would seem from your first screenshot that the FFT is not seeing enough coherent data to perform an accurate analysis. The spikes are merely an anomoly caused by the system "fishing" for data.
Dumb question: have you measured the same source with a soundcard and with the SA analyzer and compared resuts?
Comments
Hi All,
Rada: I'm afraid I'm not too knowledgable in the computer world. The only method of digitizing I can think of at the moment is recording a wav file with the soundcard. Will look at RDH tomorrow.
Phillip: I didn't annotate the first graph and perhaps I should have. On the preamp output (top trace I think) many of the spikes are harmonics of 60Hz/120Hz. Other peaks are related to those in the soundcard output, if those are real. Or it could be noise. Can you suggest a method of testing this? The preamp traces were taken with the volume control around the halfway setting. The output is significantly different from this at zero volume setting and full output setting. I will try to post some of these tomorrow. The peaks that don't correlate to power supply noise are confusing. Do you think I should zoom in and look at smaller frequency ranges since I am limited to a maximum of 2048 transforms? I am particularly interested in the anomolies of FFT results with low level signals.
Sy: Haven't tested the preamp with a soundcard yet, it is on the to do list. I have been having some problems with my soundcard lately and so I wanted to attempt an independent analysis of it's outputs before I trusted it again.
I just got the SA analyzer last week and it has sort of rekindled my measurement spirit. I did test the preamp with an even more ancient HP 302A wave analyzer quite some time back and memory tells me that the 2nd and 3rd harmonics measured with that are in good agreement with what I have gotten here. The old wave analyzer has served me well for measurements, though it is slow and tedious. The thing is sometimes a little tedium is a good thing.
Anyway, one of the things I am interested in looking at now is the noise floor and what is happening at low levels. I have no manual for the SA, but it appears to have an 80dB dynamic range. At the 0 dBV setting, no attenuation of signal nor any amplification, it overloads just above +3dB and the self noise level is ~-77dB. For low level signals up to 70dB of gain can be added to the signal. Assuming zero noise amplification this should give a -147dB floor. Is this correct? If so and added to the 0.01Hz to 300kHz range, plus that they seem to be available for less than the cost of a hinky soundcard points to a possibly interesting toy. Add the bulk, weight and the fan from hell and we're talking boatanchor heaven.
Thanks all,
Michael
Hi Michael,
I can read .wav files if you want me to perform the FFT on your data.
I think it is important to digitize in the same manner the input wave you feed into the preamp, as well as the output coming out of the preamp. Just to rule out the possibility of a distorted wave being fed into the preamp to begin with.
I have actually never done FFTs on audio-related signals, but I would imagine it is logical to check that the input is a pure sine wave. What do the experts here think?
Cheers,
Rada
PS: You can e-mail your data as input.wav and output.wav to verdee@cshl.org if you want.
but I would imagine it is logical to check that the input is a pure sine wave.
It is logical and necessary, but it won't be pure. I knew that my soundcard measurement system obsoleted fancier stuff when I was able to look at all the harmonics from the "pure" sine wave of the HP wave analyzer I had been using. But a sine wave from a good soundcard or test CD will be very, very clean (0.005% THD or less at 1kHz).
Volume Control = 0%
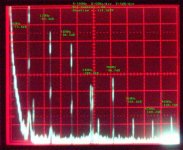
A few traces looking at the baseline noise. This one is with the soundcard connected to the inputs, no signal, volume control set to zero. The voltmeter connected to the other channel shows 200-300uV output. Mostly harmonics of line frequency with some glitchy looking stuff around 240Hz and a few shadow peaks 10Hz higher frequency. Might these be FFT anomalies?
Will follow with 1/2 vol, full vol with the same conditions.
Michael
Attachments
Full volume soundcard disconnected
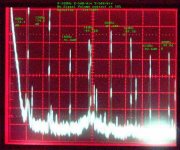
What a difference a day makes. Voltmeter reading on other channel drops back to 200uV when the soundcard is disconnected and the inputs are shorted. Still the strange behavior around 240Hz. Seems like a lot of junk coming out of the soundcard and/or cable. The cable is a regular commercially made mini-jack stereo to RCA plug 3ft. Might be interesting to make up a coax mini-jack to RCA as when using regular cable and jumpers going from the preamp to the analyzer the baseline was 10-15dB higher.
Comments?
Michael
Attachments
I still believe your extraneous peaks to be sampling anomolies since they don't really change from reading to reading.
I think your calibration may be off since noise floors of -120 are below those of 24 bit digital and too good to be true! The analyzer will probably be set for pro level, +4db or even broadcast +8db with 0 being .775mV into 600 ohms.
Show us some nice loud pink noise with smoothing turned on.
I think your calibration may be off since noise floors of -120 are below those of 24 bit digital and too good to be true! The analyzer will probably be set for pro level, +4db or even broadcast +8db with 0 being .775mV into 600 ohms.
Show us some nice loud pink noise with smoothing turned on.
Sampling
I won't argue that the odd peaks aren't an FFT artifact. This is one of the things I am trying to determine. As for noise floor too good to be true, do you mean the analyzer or my preamp or both? The dB values are clearly marked on the front of the case as referenced to 1Vrms. As for where analog leaves off and digital takes over in the analyzer, I have no idea. I should post up a picture of the brute. It is rackmount 6RU tall and 24" deep counting the power supply on the back. Opened it up and it has 21 full sized boards in it.
How about white noise? 1Vrms input to preamp and 1Vrms output from preamp. Smoothing I'm not sure I understand. What are we expecting to see?
Thanks,
Michael
Try to get a manual for the unit.
I would short the input, and use averaging, to see what the analyzer is contributing to the noise floor.
Remember a good AC voltmeter measures true rms of the entire signal over some limited bandwidth (as shown in the data sheet)
An FFT is showing you the (usually) the rms value at every "bin", which can be thought of as a bank of parallel filters. You need to sum the noise in all the bins to compare to a rms voltmeter reading, and the overall bandwidth needs to match as well.
HP / Agilent used to provide a great intro to FFT analysis, called app. note 241
Last I checked, you can still download it from the Agilent site
Bob
- Status
- Not open for further replies.
- Home
- Amplifiers
- Tubes / Valves
- FFT analysis-Truth or Consequence